0%

Python数据分析

[TOC]

1. 绪论

数据表示:

  • NumPy:[ndarray]类型和存取数据的基本方法,介绍数据的操作方式
  • matplotlib:[pyplot] 绘制数据图形
  • Pandas:[series,DataFrame] 数据分析,普通二维数据与一维数据,带有时间序列数据的使用方式

数据分析:一组数据表达的一个或多个含义

摘要:有损地提取数据特征的过程

image-20231218210055954

1.1 开发工具

文本工具

  • IDLE:Python自带

    300+行内

集成工具——通用场景

  • Wing:Vmware控制

    版本控制

  • visual studio 微软,win

    +PTVS

  • eclipse:开源IDE

    +PyDev

  • Pycharm JetBrains

集成工具——科学计算,数据分析

  • Anaconda 开源,集成开发框架

    800个第三方库

  • Canopy 收费

    500个第三方库

1.1.1 Anaconda

一个集成各类Python工具的集成平台

conda

一个包管理和环境管理工具,将工具、第三方库、Python版本、conda都当做包同等对待

  • 包管理:管理Python第三方库
  • 环境管理工具:配置相关环境,允许用户使用不同版本的Python,并自由切换
1
2
conda --version 	# 获取conda版本
conda update conda # 升级conda

anaconda

一个命名空间(、环境空间,conda的一个实例),包括conda、某版本Python、一批第三方库等

Environment信息:默认生成一个root的环境空间,可显示当前环境空间安装的包、未安装的包、待升级的包等信息

image-20231218213158470

交互式工具

Spyder

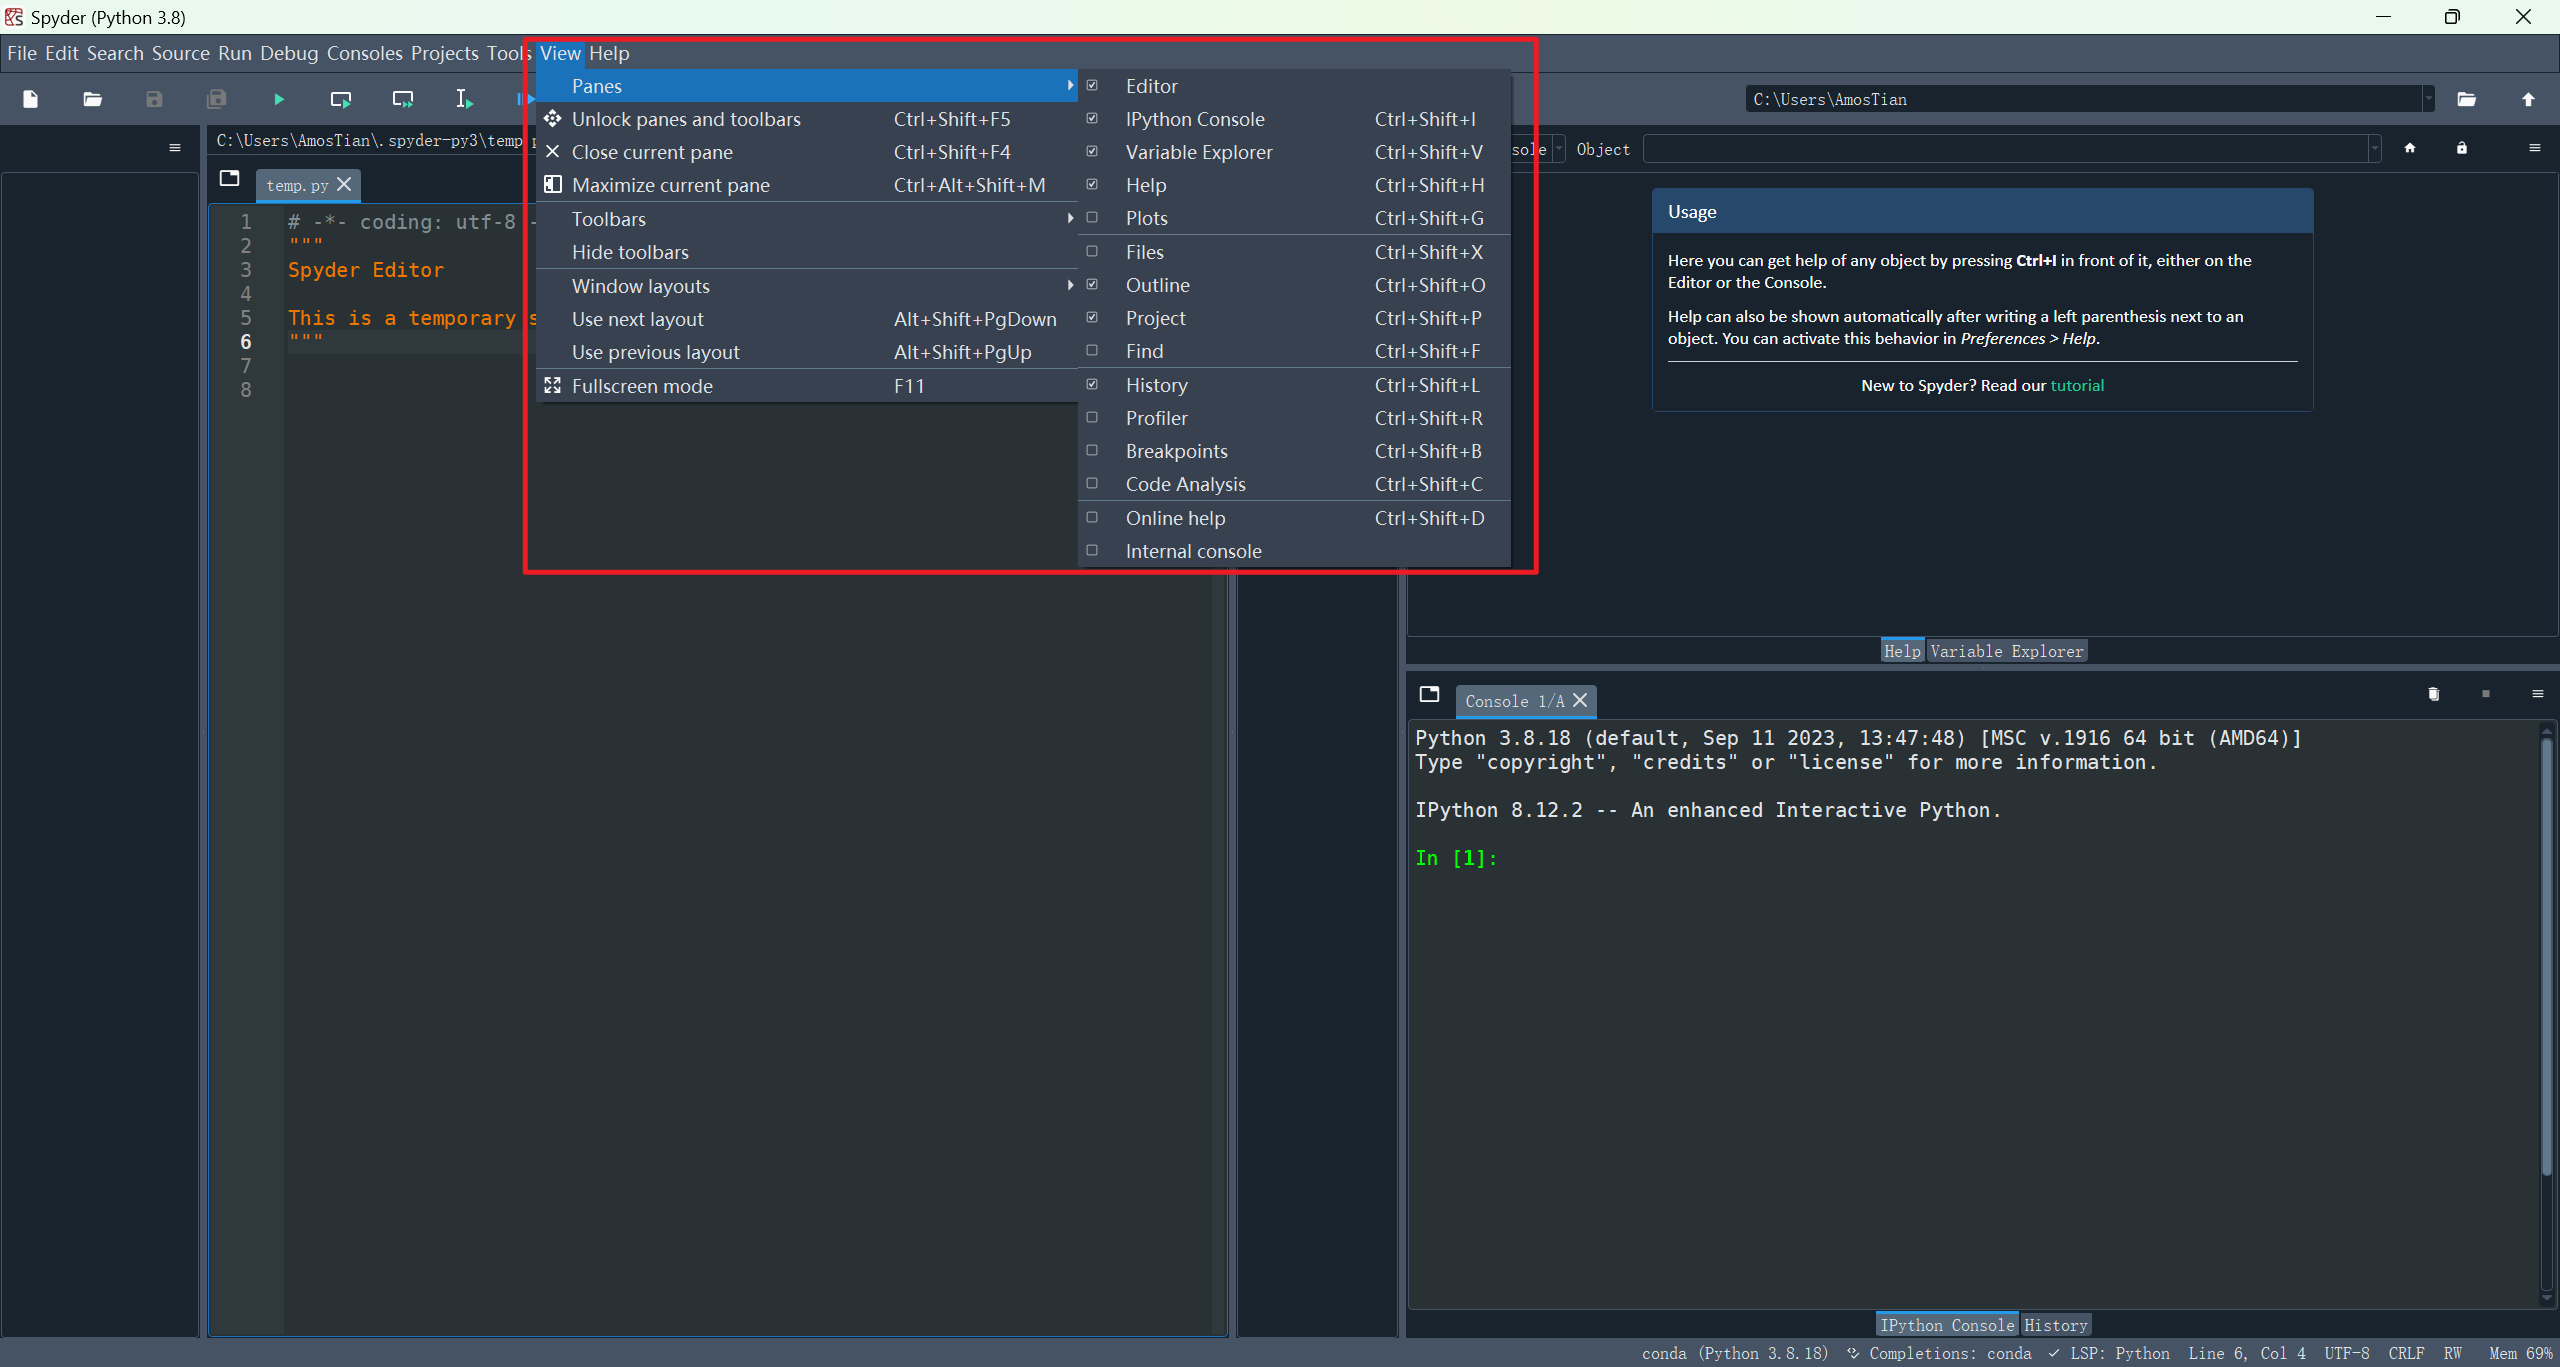
视图调整

image-20231218224200634

  • 编辑区
  • 文件导航与帮助
  • IPython:对运行结果与输入做相关响应区

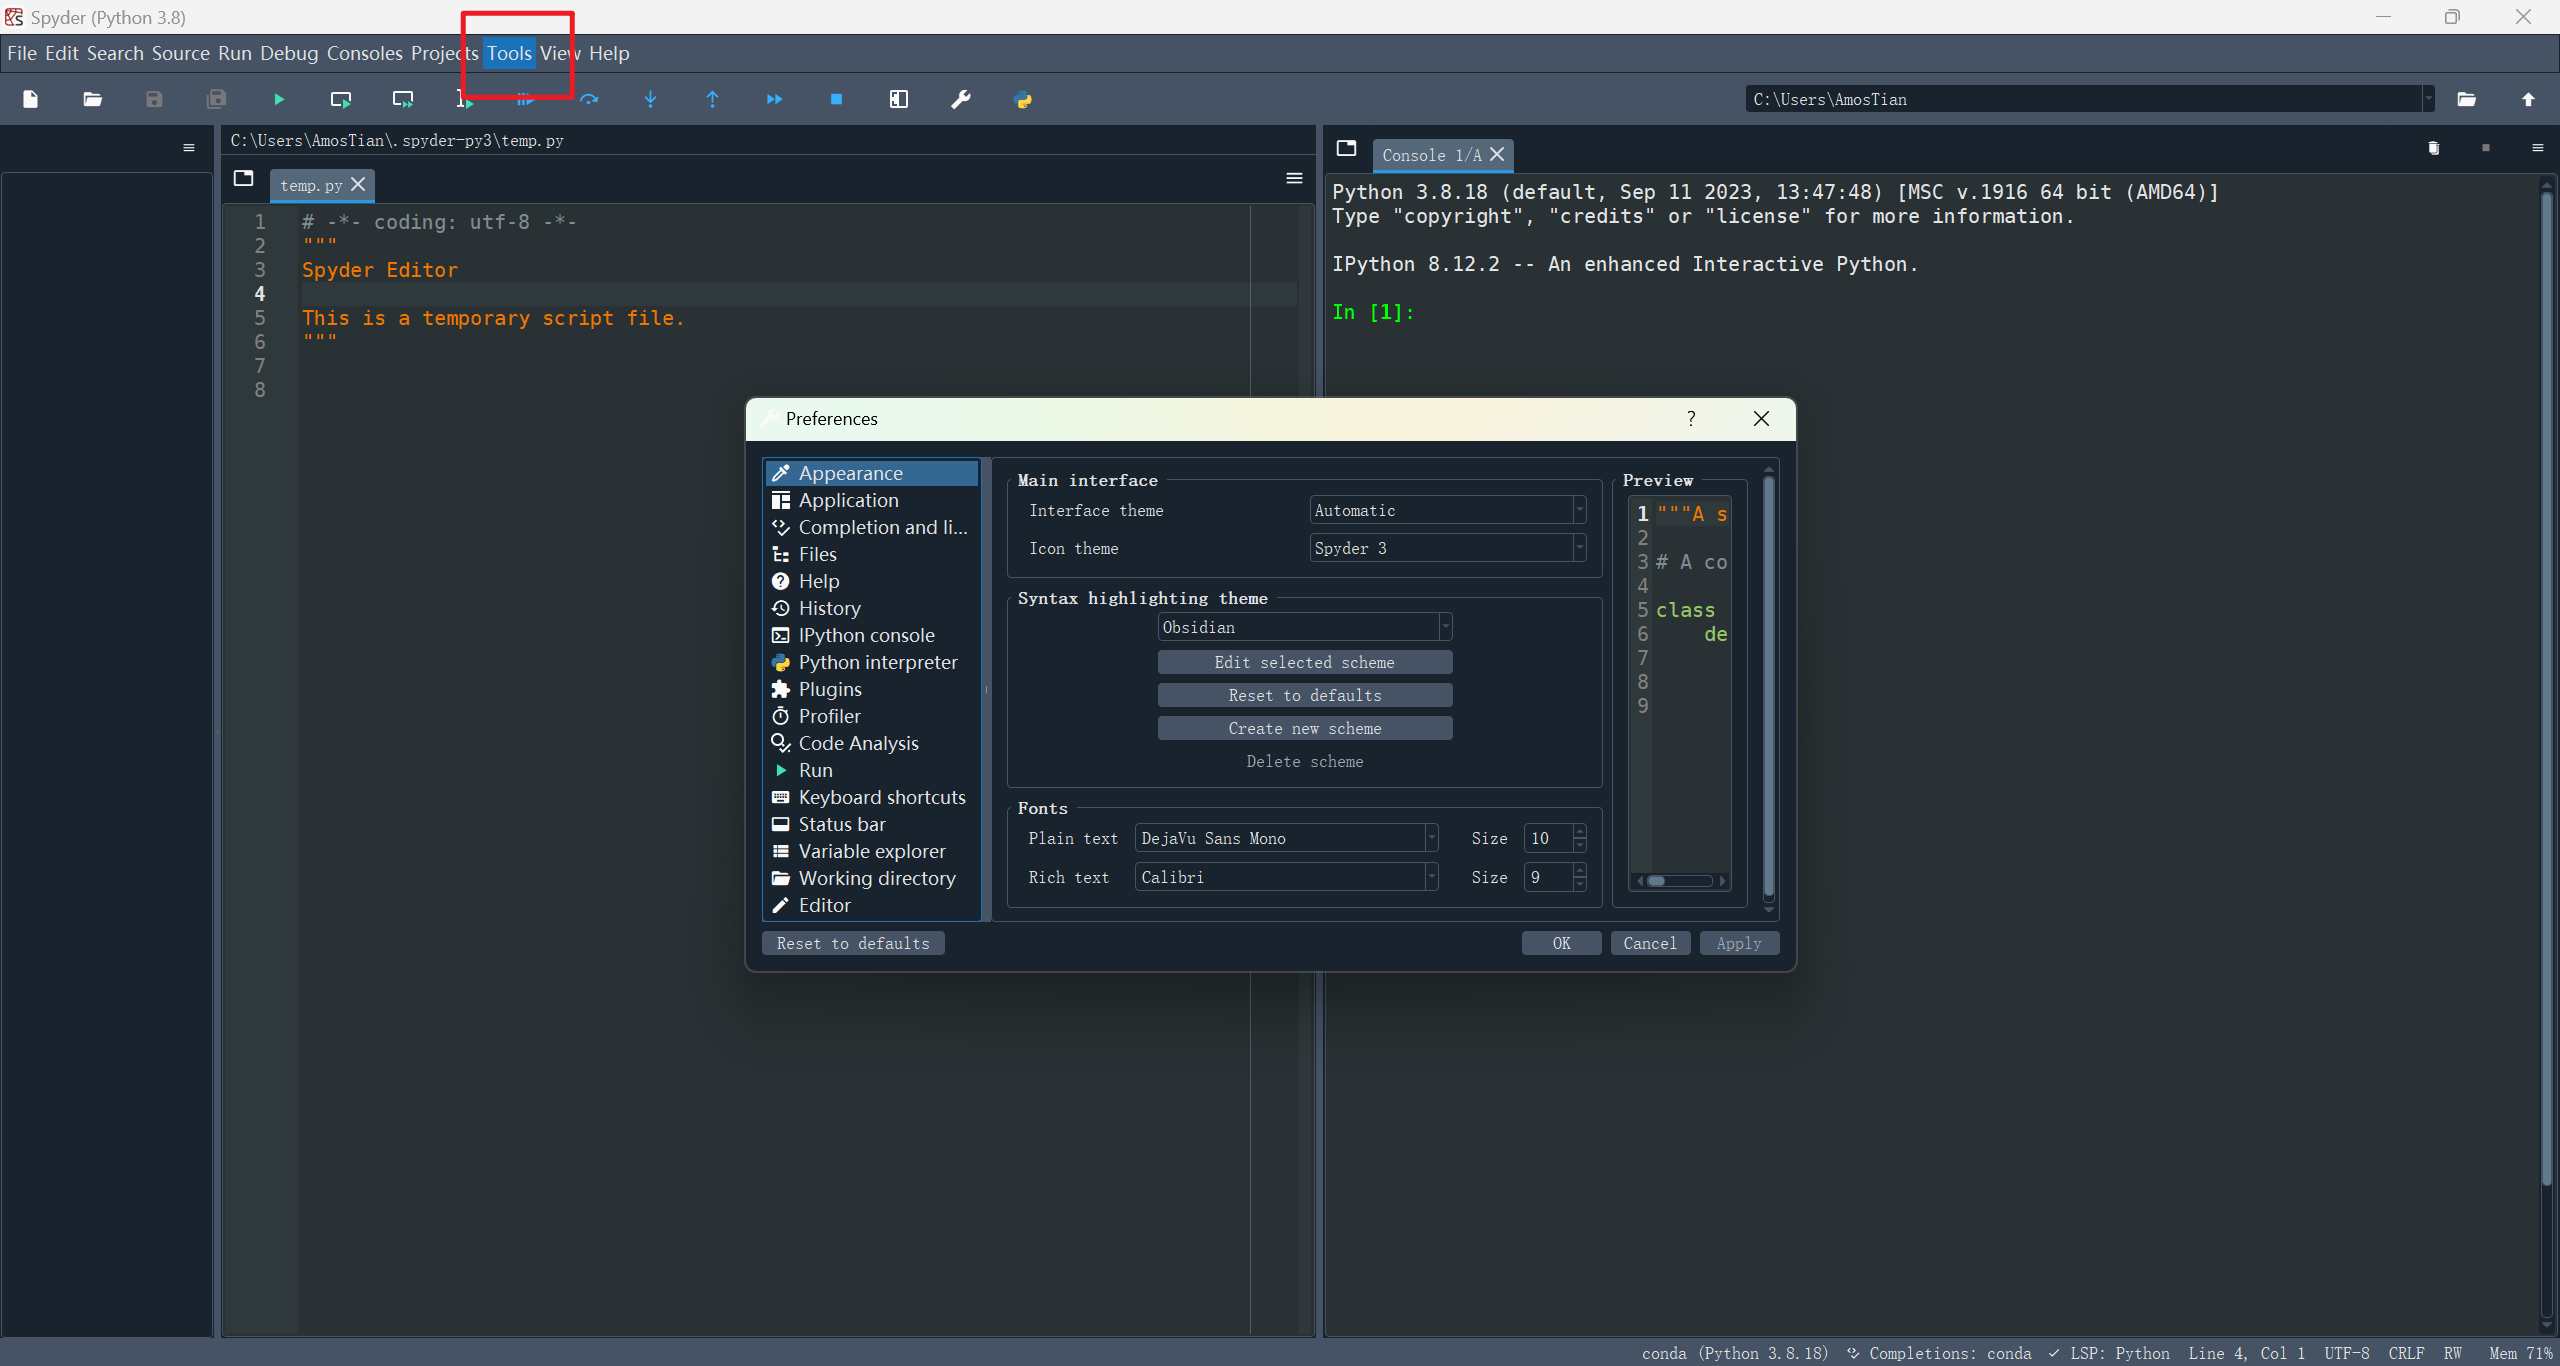
首选项

image-20231218224328495

IPython

Python解释器能根据输入得到输出,IPython是一个能够调用Python解释器的交互式显示脚本,能够显示图形、图像的GUI界面

在控制台输入
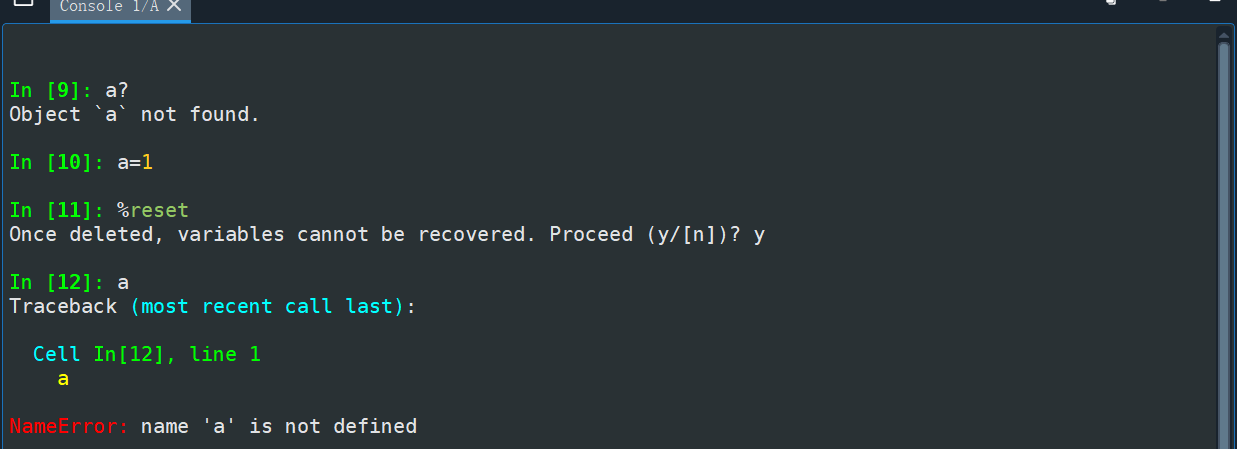
image-20231218235653800

  • 问号:a?

    • 对于变量,获取变量的相关信息

    • 对于函数,获取函数体

  • 魔术命令:%

    • %magic 显示所有魔术命令

    • %hist IPython命令的输入历史

    • %pdb 异常发生后自动进入调试器

    • %who 显示IPython当前命名空间中已经定义的变量

    • %reset 删除当前命名空间中已经定义的变量

    • %time statement 给出代码的执行时间,statement表示一段代码

    • %timeit statement 多次执行代码,计算综合平均执行时间

    • 运行:%run 文件名

      用于运行 .py 程序,%run 在一个空的命名空间执行,即文件中必须包含必要的 import lib ,因为其不借助现有的命名空间执行

jupyter notebook

交互式笔记本,支持40多种语言

本质是Web应用程序,便于创建和共享程序文档、实时代码,集文本、代码、图像、公式的展现于一体

启动

在代码目录cmd启动 jupyter notebook

jupyter模式

绿色:编辑模式

  • Tab:代码补全或缩进
  • Shift:提示
  • Shift+Enter:运行本单元,选中下一单元
  • Ctrl+Enter:运行本单元
  • Alt+Enter:运行本单元,在下方插入新单元

蓝色:执行模式

  • Shift+Enter:运行本单元,选中下一单元
  • Ctrl+Enter:运行本单元
  • Alt+Enter:运行本单元,在其下插入新单元
  • Y:单元转入代码状态
  • M:单元转入markdown状态
  • A:在上方插入新单元
  • B:在下方插入新单元
  • DD:删除选中单元

在JN中写markdown,插入单元格-写内容-转化为MD状态-执行单元

2. Numpy

2.1 NumPy包导入

1
import numpy as np # 尽量使用约定别名

特点

  • 提供N维(dim)数组对象 ndarray
  • 广播功能函数
  • 整合C/C++/Fortran 代码的工具
  • 线性代数、傅里叶变换、随机数生成等功能

2.2 ndarray

2.2.1 ndarray设计需求

计算 $A^2+B^3$ ,其中 $A$ 和 $B$ 是一维数组

1
2
3
4
5
6
7
8
9
10
11
12
13
# 使用Python基础数据类型
# 重心放在列表中每个元素的计算上
def pySum():
a=[0,1,2,3,4]
b=[9,8,7,6,5]
c=[]

for i in range(len(a)):
c.append(a[i]**2+b[i]**3)

return c

print(pySum())
1
2
3
4
5
6
7
8
9
10
11
12
13
# 数组运算可以去掉元素间运算所需的循环,简化数据运算
# 设置专门的数组对象,经过优化,可以提升运算速度
# 数组中的元素采用相同的数据类型,有助于节省运算和存储空间
import numpy as np

def npSum():
a=np.array([0,1,2,3,4])
b=np.array([9,8,7,6,5])

c=a**2+b**3
return c

print(npSum())

2.2.2 ndarray介绍

np.array 是numpy中 ndarray的别名

是一个多维数组对象,由两部分构成

  • 实际的数据

    一般要求所有的元素类型相同(同质)

  • 描述这些数据的元数据(数据维度、数据类型等)

是SciPy、Pandas的基础

数据维度

一组数据的组织形式,在数据间形成不同关系以表示不同的数据含义

image-20231218230215747

一维数据

由对等关系的有序或无序数据构成,采用线性方式组织

  • 对应 列表和集合 等概念,Python基本数据类型中不包括数组

    image-20231219094137912

类型数据元素要求eg
列表元素数据类型可以不同[3.14,'pi',[3.1401,3.1349],'3.1376']
数组元素数据类型必须相同[3.14,3.1415]
二维数据

多个一维数据组成,是一维数据的组成

列表 类型数据表示

多维数据

由一维或二维数据在新维度上扩展形成

列表类型

区别 高维数据:仅利用基本的二元关系展示数据间的复杂结构

  • 字典类型 :键值对

  • 数据表示方式 :XML、JSON、YAML

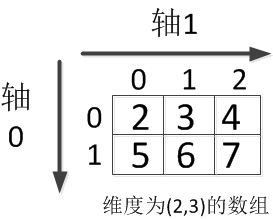
numpy轴与维度

数组维度:数组有多少维,每一维有多少元素,在np中用元组(tuple) 表示维度

  • 元组有多少元素,表示数组有多少维度——秩(rank):也即轴的数量
  • (2,3)表示第一维长度为2,第二维长度为3

:指该数组的某个维度方向

img

数组 a[2][3]=[[2,3,4],[5,6,7]]

  • 轴0方向上看有两个元素,a=[x,y]

    对轴0上元素求和相当于两个元素的求和,即 sum(a,axis=0)=[2+5,3+6,4+7]=[7,9,11]

  • 轴1方向上看有三个元素,a=[x,y,z]

    对轴1方向上求均值,相当于三个元素求均值,即 mean(a,axis=1)=[(2+3+4)/3,(5+6+7/3)]=[3,6]

这一数组表示的多维信息为:

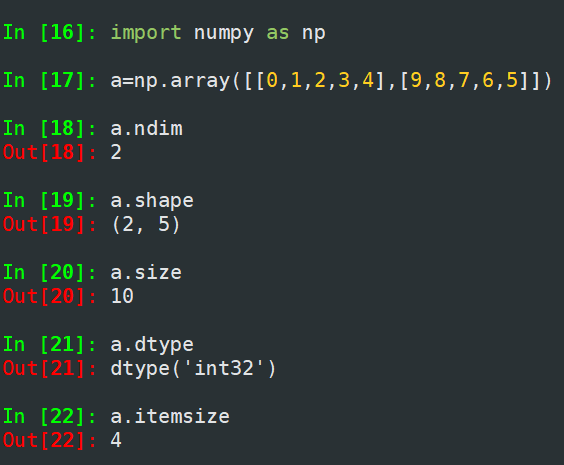
2.2.3 ndarray对象属性

属性返回类型说明
.ndimint秩,轴的数量或维度数量
.shapetuple对象的尺度,对于矩阵,则为n行m列
.sizeint元素的个数相当于 $n\times m$
.dtypedata-type元素类型
.itemsizeint单个元素的大小,以字节为单位

image-20231218235810749

ndarray数据类型

Python语法仅支持整数、浮点数和复数三种类型

  • 科学计算涉及数据较多,对存储和性能都有较高要求
  • 对数据元素类型精细定义,有助于NumPy合理使用存储空间并优化性能
  • 对于元素类型精细化定义,便于评估程序规模

ndarray 数组可以由非同质对象构成

非同质ndarray元素为对象类型,尽量避免使用

数据类型说明
bool布尔类型,True或False
intc与C语言中的int类型一致,一般是int32或int64
intp用于索引的整数,与C语言的ssize_t一致
int8字节长度的整数,取值[-128,127]
int162B长度的整数,取值[-32768,32767]
int324B长度的整数,取值 $[-2^{31},2^{31}-1]$
int648B长度的整数,取值 $[-2^{63},2^{63}-1]$
uint81B无符号整数,取值:$[0,255]$
uint162B无符号整数,取值:$[0,65535]$
uint324B无符号整数,取值:$[0,2^{32}-1]$
uint648B无符号整数,取值:$[0,2^{64}-1]$
float1616bit半精度浮点数:1bit符号位,5bit指数,10bit尾数
float3232bit半精度浮点数:1bit符号位,8bit指数,23bit尾数
float6464bit半精度浮点数:1bit符号位,11bit指数,52bit尾数
complex64复数类型,实部和虚部都是32bit浮点数
complex128复数类型,实部和虚部都是64bit浮点数

2.2.4 ndarray创建

np.array()创建

从Python中的列表、元组等类型创建ndarray数组

numpy.array(object, dtype=None, copy=True, order='K', subok=False, ndmin=0)

  • object:按一定要求将object转换为数组,支持四种类型,数组、公开数组接口的任何对象、__array__ 方法返回数组的对象、任何(嵌套)序列
  • dtype:接收data-type,表示数组所需的数据类型。若未指定,则选择保存对象所需的最小数据类型
  • ndmin:接收int,表示生成数组应具有的最小维度
1
2
x=np.array(list/tuple)
x=np.array(list/tuple,dtype=np.float32)
1
2
3
4
5
6
7
8
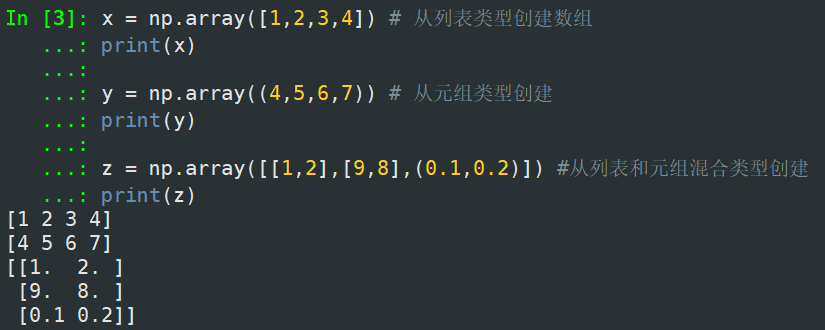
x = np.array([1,2,3,4]) # 从列表类型创建数组
print(x)

y = np.array((4,5,6,7)) # 从元组类型创建
print(y)

z = np.array([[1,2],[9,8],(0.1,0.2)]) #从列表和元组混合类型创建,只要列表与元组包含的数据个数相同就可混合使用
print(z)

image-20231219092753774

np.函数()

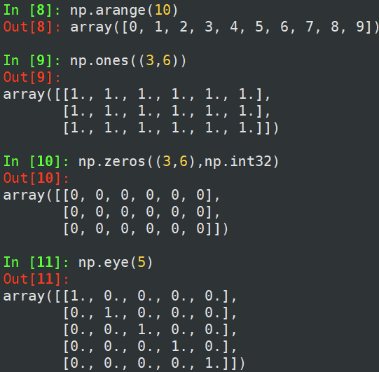
使用numpy中函数创建ndarray数组,如:arange,ones,zeros等

函数说明
np.arange(beg,end,step)元素从0到n-1,元素类型全为整数
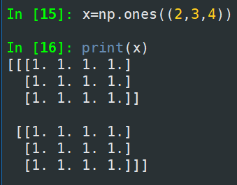
np.ones(shape)根据shape(元组类型),生成值全是1的数组
生成类型全为float,除非用dtype指定
np.zeros(shape)根据shape(元组类型),生成值全是0的数组
生成类型全为float,除非用dtype指定
np.full(shape,val)根据shape(元组类型),生成值全是val的数组
生成类型全为float,除非用dtype指定
np.eye(n)创建n维单位矩阵
np.ones_like(a)根据数组a的shape生成全1数组
np.zeros_like(a)根据数组a的shape生成全0数组
np.full_like(a,val)根据数组a的shape生成全val的数组

image-20231219102008022

image-20231219101932692

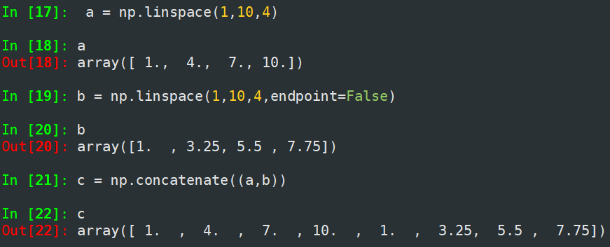
np.linspace(start, stop, num=50, endpoint=True, retstep=False,dtype=None, axis=0,)

  • 根据起止,等间距地生成num 个数据

concatenate((a1, a2, ...), axis=0, out=None, dtype=None,casting="same_kind")

  • 将两个或多个数组合并成一个新的数组

image-20231219103122276

字节流(raw bytes)创建

文件中读取特定格式创建数组

2.2.5 ndarray数组变换

对于创建好的ndarray数组,可以对其进行维度变换和元素类型变换

数组维度变换

方法说明
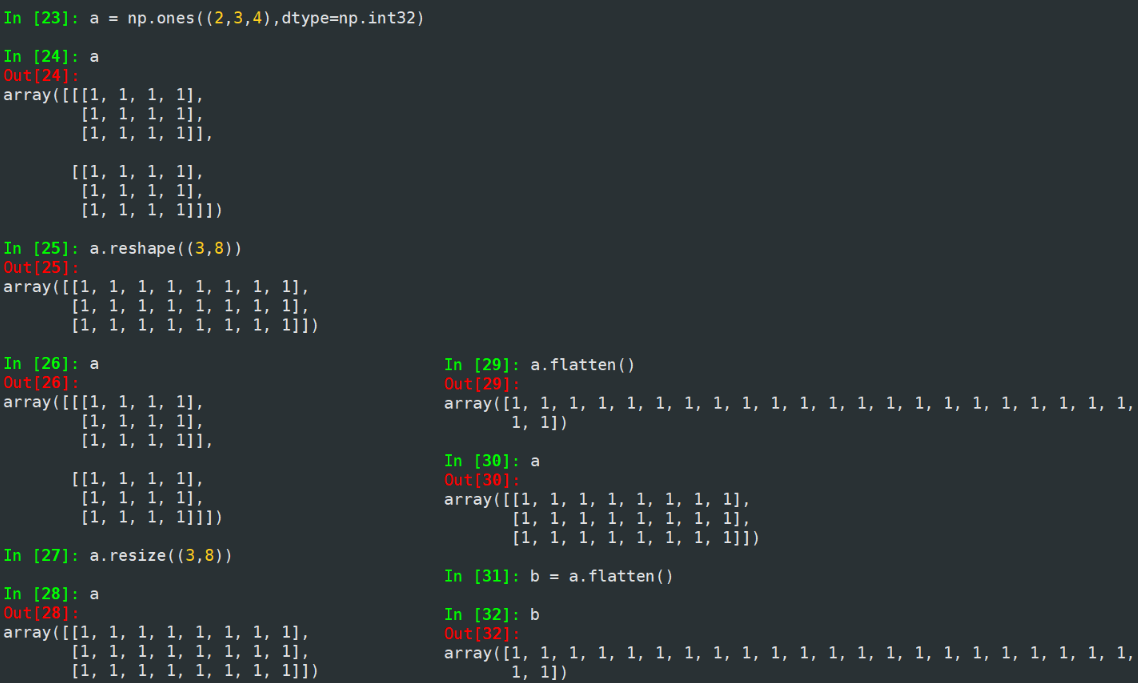
obj.reshape(shape)不改变数组元素,返回一个shape形状的数组,原数组不变
obj.resize(shape).reshape() 功能一致,但修改原数组
obj.swapaxes(ax1,ax2)将数组n个维度中的两个维度调换
obj.flatten()对数组降维,折叠为一维数组,原数组

image-20231219104215043

数组元素类型变换

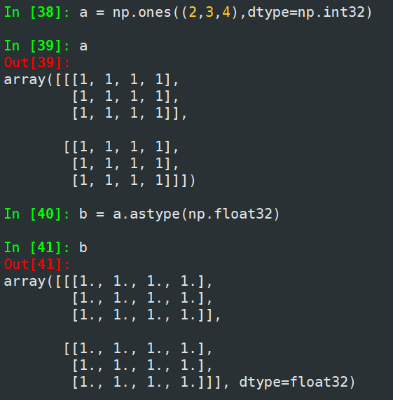
new_a=a.astype(new_dtype)

image-20231219104837744

数组向列表转换

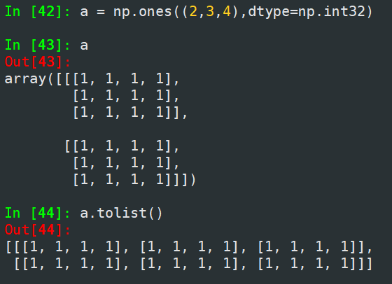
ls = a.tolist()

image-20231219105037172

2.2.6 ndarray数组的操作

数组的索引与切片

[,,,] :表示索引

[:::] :表示切片

一维数组索引+切片
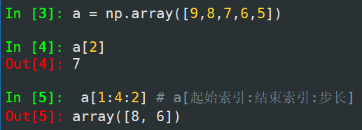
image-20231219151225184

  • 不含结束索引,所以相当于 np.array([a[1],a[3]])

二维数组索引

1
2
3
4
5
6
7
8
9
10
11
12
13
14
15
16
17
18
19
20
In [6]: a = np.arange(24).reshape((2,3,4))

In [7]: a
Out[7]:
array([[[ 0, 1, 2, 3],
[ 4, 5, 6, 7],
[ 8, 9, 10, 11]],

[[12, 13, 14, 15],
[16, 17, 18, 19],
[20, 21, 22, 23]]])

In [8]: a[1,2,3]
Out[8]: 23

In [9]: a[0,2,3]
Out[9]: 11

In [10]: a[-1,-2,-3] # 从右侧向左递减方式索引 -1表示倒数第一个元素:-2表示倒数第二个元素:-3表示倒数第三个元素
Out[10]: 17

二维数组切片

1
2
3
4
5
6
7
8
9
10
11
12
13
14
15
16
17
18
19
20
21
22
23
#第一个维度不切片,第二个维度选索引为1的元素,第二个维度选索引为倒数第三个元素
In [11]: a[:,1,-3]
Out[11]: array([ 5, 17])

#第一个维度不切片,第二个维度切1,2个元素,第三个维度不切片
In [12]: a[:,1:3,:]
Out[12]:
array([[[ 4, 5, 6, 7],
[ 8, 9, 10, 11]],

[[16, 17, 18, 19],
[20, 21, 22, 23]]])

#第一二维度不切片,第三个维度以步长为2切片,即a[,,0],a[,,2]
In [13]: a[:,:,::2]
Out[13]:
array([[[ 0, 2],
[ 4, 6],
[ 8, 10]],

[[12, 14],
[16, 18],
[20, 22]]])

数组运算

对数组的运算,相当于对数组每个元素的运算

逐元素运算
函数说明
np.abs(obj)np.fabs(obj)计算数组各元素的绝对值
np.sqrt(obj)计算数组各元素的平方根
np.sqare(obj)计算数组各元素的平方
np.log(obj) ,np.log10(obj),np.log2(obj)计算数组各元素的自然对数、10底对数和2底对数
np.ceil(obj) , np.floor(obj)计算数组中各元素的上界值与下界值
np.rint(obj)计算数组各元素的四舍五入
np.modf(obj)将数组各元素的小数和整数部分以两个独立的数组形式返回
np.cos(obj) ,np.conh(obj)
np.sin(obj),np.sinh(obj)
np.tan(obj),np.tanh(obj)
计算数组元素的普通型和双曲型三角函数
np.exp(obj)计算数组各元素的指数值
np.sign(obj)计算数组各元素的符号值,1(+),0,-1(-)
1
2
3
4
5
6
7
8
9
10
11
12
13
14
15
16
17
18
19
20
21
22
23
24
25
26
27
28
29
30
31
32
33
34
35
36
37
38
39
40
In [22]: a = np.arange(24).reshape((2,3,4))

In [23]: np.square(a)
Out[23]:
array([[[ 0, 1, 4, 9],
[ 16, 25, 36, 49],
[ 64, 81, 100, 121]],

[[144, 169, 196, 225],
[256, 289, 324, 361],
[400, 441, 484, 529]]])

In [24]: a = np.sqrt(a)

In [25]: a
Out[25]:
array([[[0. , 1. , 1.41421356, 1.73205081],
[2. , 2.23606798, 2.44948974, 2.64575131],
[2.82842712, 3. , 3.16227766, 3.31662479]],

[[3.46410162, 3.60555128, 3.74165739, 3.87298335],
[4. , 4.12310563, 4.24264069, 4.35889894],
[4.47213595, 4.58257569, 4.69041576, 4.79583152]]])

In [26]: np.modf(a)
Out[26]:
(array([[[0. , 0. , 0.41421356, 0.73205081],
[0. , 0.23606798, 0.44948974, 0.64575131],
[0.82842712, 0. , 0.16227766, 0.31662479]],

[[0.46410162, 0.60555128, 0.74165739, 0.87298335],
[0. , 0.12310563, 0.24264069, 0.35889894],
[0.47213595, 0.58257569, 0.69041576, 0.79583152]]]),
array([[[0., 1., 1., 1.],
[2., 2., 2., 2.],
[2., 3., 3., 3.]],

[[3., 3., 3., 3.],
[4., 4., 4., 4.],
[4., 4., 4., 4.]]]))
数组与标量

实例:计算数组a与元素平均值的商

1
2
3
4
5
6
7
8
9
10
11
12
13
14
15
16
17
18
19
20
21
22
23
24
25
26
27
28
In [14]: a = np.arange(24).reshape((2,3,4))

In [15]: a
Out[15]:
array([[[ 0, 1, 2, 3],
[ 4, 5, 6, 7],
[ 8, 9, 10, 11]],

[[12, 13, 14, 15],
[16, 17, 18, 19],
[20, 21, 22, 23]]])

In [16]: a_mean = a.mean()

In [17]: a_mean
Out[17]: 11.5

In [18]: a = a / a_mean

In [19]: a
Out[19]:
array([[[0. , 0.08695652, 0.17391304, 0.26086957],
[0.34782609, 0.43478261, 0.52173913, 0.60869565],
[0.69565217, 0.7826087 , 0.86956522, 0.95652174]],

[[1.04347826, 1.13043478, 1.2173913 , 1.30434783],
[1.39130435, 1.47826087, 1.56521739, 1.65217391],
[1.73913043, 1.82608696, 1.91304348, 2. ]]])
数组间运算

若参与运算的两个数组中的元素类型(dtype)不同,则会将元素类型向上转换

函数说明
+,-,*,/,**两个数组各元素进行对应运算
np.maximum(x,y) , np.fmax()
np.minimum(x,y) , np.fmin()
元素级的最大值/最小值计算
fmax会忽略NAN,maximum会传播NAN
np.mod(x,y)元素级模运算
np.copysign(x,y)将y数组中各元素的值符号赋值给数组x对应元素
>,<,> = ,< = ,==,! =算数比较,产生布尔类型数组
1
2
3
4
5
6
7
8
9
10
11
12
13
14
15
16
17
18
19
20
21
22
23
24
25
26
27
28
29
30
31
32
33
34
35
In [35]: a = np.arange(24).reshape((2,3,4))

In [36]: b
Out[36]:
array([[[0. , 1. , 1.41421356, 1.73205081],
[2. , 2.23606798, 2.44948974, 2.64575131],
[2.82842712, 3. , 3.16227766, 3.31662479]],

[[3.46410162, 3.60555128, 3.74165739, 3.87298335],
[4. , 4.12310563, 4.24264069, 4.35889894],
[4.47213595, 4.58257569, 4.69041576, 4.79583152]]])

In [37]: a = np.arange(24).reshape((2,3,4))

In [38]: b = np.sqrt(a)

In [39]: np.minimum(a,b)
Out[39]:
array([[[0. , 1. , 1.41421356, 1.73205081],
[2. , 2.23606798, 2.44948974, 2.64575131],
[2.82842712, 3. , 3.16227766, 3.31662479]],

[[3.46410162, 3.60555128, 3.74165739, 3.87298335],
[4. , 4.12310563, 4.24264069, 4.35889894],
[4.47213595, 4.58257569, 4.69041576, 4.79583152]]])

In [40]: a > b
Out[40]:
array([[[False, False, True, True],
[ True, True, True, True],
[ True, True, True, True]],

[[ True, True, True, True],
[ True, True, True, True],
[ True, True, True, True]]])

2.3 文件中读取数据

2.3.1 一/二维数据——CSV文件

CSV文件(Comma-Separated Value,逗号分隔值),常用于批量存储数据

image-20231219194712437

适用数据类型

CSV只能有效存储一维和二维数组

写入csv文件

np.savetxt(frame,array,fmt='%.18e',delimiter=None)

  • frame:文件、字符串或产生器,可以是.gz或.bz2的压缩文件

  • array:存储文件的数组

  • fmt:写入文件的数据格式,例如:%d %.2f %.18e

    %.18e 是科学计数法,保留18位小数

  • delimiter:分割字符串,默认是任何空格

1
2
3
4
5
6
7
8
9
10
11
12
13
14
15
16
In [41]: a = np.arange(100).reshape(5,20)

In [42]: a
Out[42]:
array([[ 0, 1, 2, 3, 4, 5, 6, 7, 8, 9, 10, 11, 12, 13, 14, 15,
16, 17, 18, 19],
[20, 21, 22, 23, 24, 25, 26, 27, 28, 29, 30, 31, 32, 33, 34, 35,
36, 37, 38, 39],
[40, 41, 42, 43, 44, 45, 46, 47, 48, 49, 50, 51, 52, 53, 54, 55,
56, 57, 58, 59],
[60, 61, 62, 63, 64, 65, 66, 67, 68, 69, 70, 71, 72, 73, 74, 75,
76, 77, 78, 79],
[80, 81, 82, 83, 84, 85, 86, 87, 88, 89, 90, 91, 92, 93, 94, 95,
96, 97, 98, 99]])

In [43]: np.savetxt('a.csv',a,fmt='%d',delimiter=',')

image-20231219195900800

1
In [44]: np.savetxt('a.csv',a,fmt='%.1f',delimiter=',')

image-20231219195952351

读取csv文件

np.loadtxt(frame,dtype=np.float32,delimiter=None,unpack=False)

  • frame:文件、字符串或产生器,可以是.gz或.bz2的压缩文件
  • dtype:数据类型,可选
  • delimiter:指定数据的分割字符串,默认是任何空格
  • unpack:如果是True,读入属性将分别写入不同变量
1
2
3
4
5
6
7
8
9
10
11
12
13
14
15
16
17
18
19
20
21
22
23
24
25
26
27
28
29
30
31
32
33
34
35
36
37
In [46]: b = np.loadtxt('a.csv',delimiter=',')

In [47]: b
Out[47]:
array([[ 0., 1., 2., 3., 4., 5., 6., 7., 8., 9., 10., 11., 12.,
13., 14., 15., 16., 17., 18., 19.],
[20., 21., 22., 23., 24., 25., 26., 27., 28., 29., 30., 31., 32.,
33., 34., 35., 36., 37., 38., 39.],
[40., 41., 42., 43., 44., 45., 46., 47., 48., 49., 50., 51., 52.,
53., 54., 55., 56., 57., 58., 59.],
[60., 61., 62., 63., 64., 65., 66., 67., 68., 69., 70., 71., 72.,
73., 74., 75., 76., 77., 78., 79.],
[80., 81., 82., 83., 84., 85., 86., 87., 88., 89., 90., 91., 92.,
93., 94., 95., 96., 97., 98., 99.]])

In [49]: b = np.loadtxt('a.csv',dtype=np.int32,delimiter=',')
..\ipykernel_25716\1206317582.py:1: DeprecationWarning: loadtxt(): Parsing an integer via a float is deprecated. To avoid this warning, you can:
* make sure the original data is stored as integers.
* use the `converters=` keyword argument. If you only use
NumPy 1.23 or later, `converters=float` will normally work.
* Use `np.loadtxt(...).astype(np.int64)` parsing the file as
floating point and then convert it. (On all NumPy versions.)
(Deprecated NumPy 1.23)
b = np.loadtxt('a.csv',dtype=np.int32,delimiter=',')

In [50]: b
Out[50]:
array([[ 0, 1, 2, 3, 4, 5, 6, 7, 8, 9, 10, 11, 12, 13, 14, 15,
16, 17, 18, 19],
[20, 21, 22, 23, 24, 25, 26, 27, 28, 29, 30, 31, 32, 33, 34, 35,
36, 37, 38, 39],
[40, 41, 42, 43, 44, 45, 46, 47, 48, 49, 50, 51, 52, 53, 54, 55,
56, 57, 58, 59],
[60, 61, 62, 63, 64, 65, 66, 67, 68, 69, 70, 71, 72, 73, 74, 75,
76, 77, 78, 79],
[80, 81, 82, 83, 84, 85, 86, 87, 88, 89, 90, 91, 92, 93, 94, 95,
96, 97, 98, 99]])

2.3.2 多维数据

需要知道 数据类型数组维度信息

写入文件

ndarry_obj.tofile(frame,sep='',format='%s')

  • frame:文件、字符串
  • sep:数据分割字符串,如果是空串,写入文件为二进制
  • format:写入数据的格式
1
2
3
4
5
6
7
8
9
10
11
12
13
14
15
16
17
In [54]: a = np.arange(100).reshape(2,5,10)

In [55]: a
Out[55]:
array([[[ 0, 1, 2, 3, 4, 5, 6, 7, 8, 9],
[10, 11, 12, 13, 14, 15, 16, 17, 18, 19],
[20, 21, 22, 23, 24, 25, 26, 27, 28, 29],
[30, 31, 32, 33, 34, 35, 36, 37, 38, 39],
[40, 41, 42, 43, 44, 45, 46, 47, 48, 49]],

[[50, 51, 52, 53, 54, 55, 56, 57, 58, 59],
[60, 61, 62, 63, 64, 65, 66, 67, 68, 69],
[70, 71, 72, 73, 74, 75, 76, 77, 78, 79],
[80, 81, 82, 83, 84, 85, 86, 87, 88, 89],
[90, 91, 92, 93, 94, 95, 96, 97, 98, 99]]])

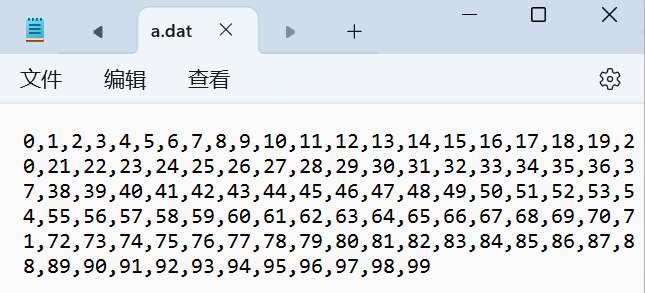
In [56]: a.tofile('a.dat',sep=',',format='%d')

image-20231219202353080

若不指定分割符 sep,则生成二进制文件

  • 二进制文件占用空间小比文本文件小
1
In [57]: a.tofile('a.dat',format='%d')

image-20231219202835796

读取文件

np.fromfile(frame,dtype=float32,count=-1,sep='')

  • frame:文件、字符串
  • dtype:读取文件的数据类型
  • count:读元素个数,默认-1表示读入整个文件
  • sep:数据分割支持字符串,如果是空串,则写入文件为二进制文件
1
2
3
4
5
6
7
8
9
10
11
12
13
14
15
16
17
18
19
20
21
22
23
24
25
26
27
28
29
30
31
32
33
34
35
36
37
38
39
40
41
42
43
44
45
# 文本文件的读写
In [58]: a = np.arange(100).reshape(2,5,10)

In [59]: a
Out[59]:
array([[[ 0, 1, 2, 3, 4, 5, 6, 7, 8, 9],
[10, 11, 12, 13, 14, 15, 16, 17, 18, 19],
[20, 21, 22, 23, 24, 25, 26, 27, 28, 29],
[30, 31, 32, 33, 34, 35, 36, 37, 38, 39],
[40, 41, 42, 43, 44, 45, 46, 47, 48, 49]],

[[50, 51, 52, 53, 54, 55, 56, 57, 58, 59],
[60, 61, 62, 63, 64, 65, 66, 67, 68, 69],
[70, 71, 72, 73, 74, 75, 76, 77, 78, 79],
[80, 81, 82, 83, 84, 85, 86, 87, 88, 89],
[90, 91, 92, 93, 94, 95, 96, 97, 98, 99]]])

In [60]: a.tofile('a.dat',sep=',',format='%d') # 写入文本文件

In [61]: c = np.fromfile('a.dat',dtype=np.int32,sep=',')

In [62]: c
Out[62]:
array([ 0, 1, 2, 3, 4, 5, 6, 7, 8, 9, 10, 11, 12, 13, 14, 15, 16,
17, 18, 19, 20, 21, 22, 23, 24, 25, 26, 27, 28, 29, 30, 31, 32, 33,
34, 35, 36, 37, 38, 39, 40, 41, 42, 43, 44, 45, 46, 47, 48, 49, 50,
51, 52, 53, 54, 55, 56, 57, 58, 59, 60, 61, 62, 63, 64, 65, 66, 67,
68, 69, 70, 71, 72, 73, 74, 75, 76, 77, 78, 79, 80, 81, 82, 83, 84,
85, 86, 87, 88, 89, 90, 91, 92, 93, 94, 95, 96, 97, 98, 99])

In [63]: c = np.fromfile('a.dat',dtype=np.int32,sep=',').reshape(2,5,10)

In [64]: c
Out[64]:
array([[[ 0, 1, 2, 3, 4, 5, 6, 7, 8, 9],
[10, 11, 12, 13, 14, 15, 16, 17, 18, 19],
[20, 21, 22, 23, 24, 25, 26, 27, 28, 29],
[30, 31, 32, 33, 34, 35, 36, 37, 38, 39],
[40, 41, 42, 43, 44, 45, 46, 47, 48, 49]],

[[50, 51, 52, 53, 54, 55, 56, 57, 58, 59],
[60, 61, 62, 63, 64, 65, 66, 67, 68, 69],
[70, 71, 72, 73, 74, 75, 76, 77, 78, 79],
[80, 81, 82, 83, 84, 85, 86, 87, 88, 89],
[90, 91, 92, 93, 94, 95, 96, 97, 98, 99]]])
1
2
3
4
5
6
7
8
9
10
11
12
13
14
15
16
17
18
19
20
21
22
23
24
25
26
27
28
29
30
31
# 二进制文件的读写
In [65]: a = np.arange(100).reshape(2,5,10)

In [66]: a.tofile('a.dat',format='%d')

In [67]: c = np.fromfile('a.dat',dtype=np.int32).reshape(2,5,10)

In [68]: c
Out[68]:
array([[[ 0, 1, 2, 3, 4, 5, 6, 7, 8, 9],
[10, 11, 12, 13, 14, 15, 16, 17, 18, 19],
[20, 21, 22, 23, 24, 25, 26, 27, 28, 29],
[30, 31, 32, 33, 34, 35, 36, 37, 38, 39],
[40, 41, 42, 43, 44, 45, 46, 47, 48, 49]],

[[50, 51, 52, 53, 54, 55, 56, 57, 58, 59],
[60, 61, 62, 63, 64, 65, 66, 67, 68, 69],
[70, 71, 72, 73, 74, 75, 76, 77, 78, 79],
[80, 81, 82, 83, 84, 85, 86, 87, 88, 89],
[90, 91, 92, 93, 94, 95, 96, 97, 98, 99]]])

In [69]: c = np.fromfile('a.dat',dtype=np.int32)

In [70]: c
Out[70]:
array([ 0, 1, 2, 3, 4, 5, 6, 7, 8, 9, 10, 11, 12, 13, 14, 15, 16,
17, 18, 19, 20, 21, 22, 23, 24, 25, 26, 27, 28, 29, 30, 31, 32, 33,
34, 35, 36, 37, 38, 39, 40, 41, 42, 43, 44, 45, 46, 47, 48, 49, 50,
51, 52, 53, 54, 55, 56, 57, 58, 59, 60, 61, 62, 63, 64, 65, 66, 67,
68, 69, 70, 71, 72, 73, 74, 75, 76, 77, 78, 79, 80, 81, 82, 83, 84,
85, 86, 87, 88, 89, 90, 91, 92, 93, 94, 95, 96, 97, 98, 99])

2.3.3 NumPy便捷文件存取

np.save(frame,ndarray)np.savez(frame,ndarray)

  • frame:文件名,以 .npy 为扩展名,压缩扩展名为 .npz
  • array:数组变量

np.load(fname)

  • fname:文件名,以 .npy 或 .npz 为扩展名
1
2
3
4
5
6
7
8
9
10
11
12
13
14
15
16
17
18
19
In [71]: a = np.arange(100).reshape(2,5,10)

In [72]: np.save('a.npy',a)

In [73]: b = np.load('a.npy')

In [74]: b
Out[74]:
array([[[ 0, 1, 2, 3, 4, 5, 6, 7, 8, 9],
[10, 11, 12, 13, 14, 15, 16, 17, 18, 19],
[20, 21, 22, 23, 24, 25, 26, 27, 28, 29],
[30, 31, 32, 33, 34, 35, 36, 37, 38, 39],
[40, 41, 42, 43, 44, 45, 46, 47, 48, 49]],

[[50, 51, 52, 53, 54, 55, 56, 57, 58, 59],
[60, 61, 62, 63, 64, 65, 66, 67, 68, 69],
[70, 71, 72, 73, 74, 75, 76, 77, 78, 79],
[80, 81, 82, 83, 84, 85, 86, 87, 88, 89],
[90, 91, 92, 93, 94, 95, 96, 97, 98, 99]]])

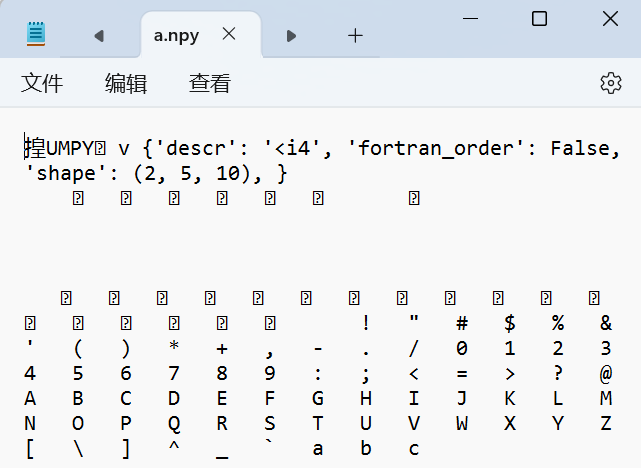
npy将数组元信息写入第一行

image-20231219204717514

若数据只存在与py文件中,则考虑.npy文件

若数据需要与其他程序交互,则考虑csv或dat文件

2.4 NumPy常用函数

2.4.1 随机数生成

NumPy的random子库中的函数为ndarray提供随机数

np.random.*

函数说明
rand(d0,d1,...,dn)根据维度信息d0-dn,创建随机浮点数数组,[0,1)均匀分布
每个元素从均匀分布总体中选取出来,即每个元素被抽取的概率相同
randn(d0,d1,...,dn)根据维度信息d0-dn创建随机数组,标准正态分布
每个元素从正态分布总体中选取出来
randint(low,[high,shape])创建随机整数数组,范围为 [low,high)
seed(s)随机数种子,s是给定的种子值
1
2
3
4
5
6
7
8
9
10
11
12
13
14
15
16
17
18
19
20
21
22
23
24
25
26
27
28
29
30
31
32
33
34
35
36
37
38
39
40
41
42
43
44
45
In [75]:  a = np.random.rand(2,3,4)

In [76]: a
Out[76]:
array([[[0.45837884, 0.82893806, 0.18047275, 0.03248048],
[0.93020038, 0.94885799, 0.39227657, 0.45814434],
[0.13152265, 0.37268271, 0.22214262, 0.49515611]],

[[0.81851534, 0.32840865, 0.07799763, 0.57159495],
[0.58134676, 0.45702106, 0.75713087, 0.81451658],
[0.11602932, 0.19518582, 0.53516332, 0.05679252]]])

In [78]: a = np.random.randn(2,3,4)

In [79]: a
Out[79]:
array([[[ 1.19039369, -0.50135829, -1.34244396, 0.91445294],
[-0.55127657, -0.36359796, -0.36445161, 1.32271641],
[ 1.26946294, 1.40557906, 0.08226739, -0.58369293]],

[[-0.48358501, -0.19845588, 1.48634899, 0.0732427 ],
[ 0.74060483, 2.22572113, -0.79883423, -0.94264226],
[-1.65189778, 1.42670806, -0.04063335, -0.99500735]]])


In [80]: b = np.random.randint(100,200,(2,3))

In [81]: b
Out[81]:
array([[172, 106, 197],
[179, 118, 158]])

In [82]: np.random.seed(10)

In [83]: np.random.randint(100,200,(2,3))
Out[83]:
array([[109, 115, 164],
[128, 189, 193]])

In [84]: np.random.seed(10)

In [85]: np.random.randint(100,200,(2,3))
Out[85]:
array([[109, 115, 164],
[128, 189, 193]])
  • 当指定种子后,会生成相同的随机数序列
函数说明
shuffle(obj)将数组obj的第0轴最外层维度进行随机排列,改变数组obj
permutation(obj)将数组obj的第0轴最外层维度随机排列,产生新的乱序数组,不改变obj
choice(obj[,size,replace,p])从一维数组obj中以概率p抽取元素,形成size形状的新数组,replace表示是否可重用元素,默认为True
1
2
3
4
5
6
7
8
9
10
11
12
13
14
15
In [86]: a = np.random.randint(100,200,(3,4))

In [87]: a
Out[87]:
array([[129, 108, 173, 100],
[140, 136, 116, 111],
[154, 188, 162, 133]])

In [88]: np.random.shuffle(a)

In [89]: a
Out[89]:
array([[140, 136, 116, 111],
[154, 188, 162, 133],
[129, 108, 173, 100]])
1
2
3
4
5
6
7
8
9
10
11
12
13
14
15
16
17
18
19
In [94]: a = np.random.randint(100,200,(3,4))

In [95]: a
Out[95]:
array([[112, 165, 131, 157],
[136, 127, 118, 193],
[177, 122, 123, 194]])

In [96]: np.random.permutation(a)
Out[96]:
array([[177, 122, 123, 194],
[136, 127, 118, 193],
[112, 165, 131, 157]])

In [97]: a
Out[97]:
array([[112, 165, 131, 157],
[136, 127, 118, 193],
[177, 122, 123, 194]])
1
2
3
4
5
6
7
8
9
10
11
12
13
14
15
16
17
18
19
20
21
22
In [98]: a  = np.random.randint(100,200,8)

In [99]: a
Out[99]: array([128, 174, 188, 109, 115, 118, 180, 171])

In [100]: np.random.choice(a,(3,2))
Out[100]:
array([[128, 109],
[174, 180],
[171, 109]])

In [101]: np.random.choice(a,(3,2),replace=False)
Out[101]:
array([[180, 118],
[109, 128],
[188, 171]])

In [102]: np.random.choice(a,(3,2),p=a/np.sum(a)) # 元素值越大,被抽取的概率越高
Out[102]:
array([[171, 188],
[180, 188],
[171, 188]])
函数说明
uniform(low,high,size)元素服从指定均匀分布的数组,[low,high],size形状
normal(loc,scale,size)元素服从指定正态分布的数组,loc均值,scale标准差,size形状
poisson(lam,size)元素服从指定泊松分布的数组,lam为随机事件发生率,size形状
1
2
3
4
5
6
7
8
9
10
11
In [103]: np.random.normal(0,1,(3,4))
Out[103]:
array([[-0.36225179, -1.12913125, -0.34971048, -1.05272652],
[ 1.28227668, -0.17180538, 0.57765806, -1.47497488],
[ 0.07878845, 0.91841365, -0.49269736, 0.09646237]])

In [104]: np.random.uniform(0,10,(3,4))
Out[104]:
array([[3.57181759, 0.7961309 , 3.05459918, 3.30719312],
[7.73830296, 0.39959209, 4.29492178, 3.14926872],
[6.36491143, 3.4634715 , 0.43097356, 8.79915175]])

2.4.2 统计函数

对数组中信息进行统计

np.* 调用

函数说明
sum(a,axis=None)计算数组a在给定轴axis上元素的和,axis整数或元组
mean(a,axis=None)计算数组a在给定轴axis上元素的期望,axis整数或元组
average(a,axis=None,weights=None)计算数组a在给定轴axis上元素的加权平均值
std(a,axis=None)计算数组a在给定轴axis上元素的标准差
var(a,axis=None)计算数组a在给定轴axis上元素的方差
1
2
3
4
5
6
7
8
9
10
11
12
13
14
15
16
17
18
19
20
21
22
23
24
25
26
27
28
29
30
31
32
33
34
In [13]: a = np.arange(15).reshape(3,5)

In [14]: a
Out[14]:
array([[ 0, 1, 2, 3, 4],
[ 5, 6, 7, 8, 9],
[10, 11, 12, 13, 14]])

In [15]: np.sum(a)
Out[15]: 105

In [16]: np.sum(a,axis=(0,1))
Out[16]: 105

In [17]: np.sum(a,axis=0)
Out[17]: array([15, 18, 21, 24, 27])

In [18]: np.mean(a)
Out[18]: 7.0

In [19]: np.mean(a,axis=0)
Out[19]: array([5., 6., 7., 8., 9.])

In [20]: np.mean(a,axis=1)
Out[20]: array([ 2., 7., 12.])

In [21]: np.average(a,axis=0,weights=[10,5,1])
Out[21]: array([2.1875, 3.1875, 4.1875, 5.1875, 6.1875])

In [22]: np.std(a)
Out[22]: 4.320493798938574

In [23]: np.var(a)
Out[23]: 18.666666666666668
函数说明
min(a) , max(a)计算数组a中元素的最小值、最大值
argmin(a) , argmax(a)计算数组a中元素最小值,最大值的扁平化后下标
unravel_index(index,shape)根据shape将扁平化后下标index重塑为多维下标
ptp(a)计算数组a中元素最大值与最小值的差
median(a)计算数组a中元素的中位数
1
2
3
4
5
6
7
8
9
10
11
12
13
14
15
16
17
18
19
20
21
22
In [123]: b = np.arange(15,0,-1).reshape(3,5)

In [124]: b
Out[124]:
array([[15, 14, 13, 12, 11],
[10, 9, 8, 7, 6],
[ 5, 4, 3, 2, 1]])

In [125]: np.max(b)
Out[125]: 15

In [126]: np.argmax(b)
Out[126]: 0

In [127]: np.unravel_index(np.argmax(b),b.shape)
Out[127]: (0, 0)

In [128]: np.ptp(b)
Out[128]: 14

In [129]: np.median(b)
Out[129]: 8.0

2.4.3 梯度函数

np.gradient(f) 计算数组f中元素的梯度

1
2
3
4
5
6
7
In [130]: a = np.random.randint(0,20,(5))

In [131]: a
Out[131]: array([ 9, 12, 18, 17, 17])

In [132]: np.gradient(a)
Out[132]: array([ 3. , 4.5, 2.5, -0.5, 0. ])
  • 对于4.5,$\frac{(18-9)}{2}=4.5$
  • 对于3,$\frac{12-9}{1=3}$
1
2
3
4
5
6
7
8
9
10
11
12
13
14
In [134]: a
Out[134]:
array([[16, 0, 31, 37, 9],
[ 0, 38, 22, 32, 2],
[ 3, 31, 35, 27, 18]])

In [135]: np.gradient(a)
Out[135]:
[array([[-16. , 38. , -9. , -5. , -7. ],#0轴梯度
[ -6.5, 15.5, 2. , -5. , 4.5],
[ 3. , -7. , 13. , -5. , 16. ]]),
array([[-16. , 7.5, 18.5, -11. , -28. ],#1轴梯度
[ 38. , 11. , -3. , -10. , -30. ],
[ 28. , 16. , -2. , -8.5, -9. ]])]

2.5 图像与numpy

2.5.1 图像的数组表示

RGB色彩模式,形成三个通道,三个颜色通道的变化与叠加得到各种颜色

  • R:图像上每个像素点红色通道取值范围,0-255
  • G:图像上每个像素点绿色通道取值范围,0-255
  • B:图像上每个像素点蓝色通道取值范围,0-255

PIL库

用于处理图像的第三方Python库,Python Image Library

安装:pip install pillow

导入:from PIL import Image

  • Image为PIL库中一个图像的类

图像的数组表示

图像是一个由像素组成的二维矩阵,每个元素是一个RGB值(三个字节表示一个像素点的RGB)

1
2
3
4
5
6
7
8
9
10
11
12
13
14
15
16
17
18
19
20
21
22
23
24
25
26
27
28
29
30
31
32
33
34
35
36
37
38
39
40
41
42
43
44
45
46
47
48
49
In [32]: from PIL import Image

In [33]: import numpy as np

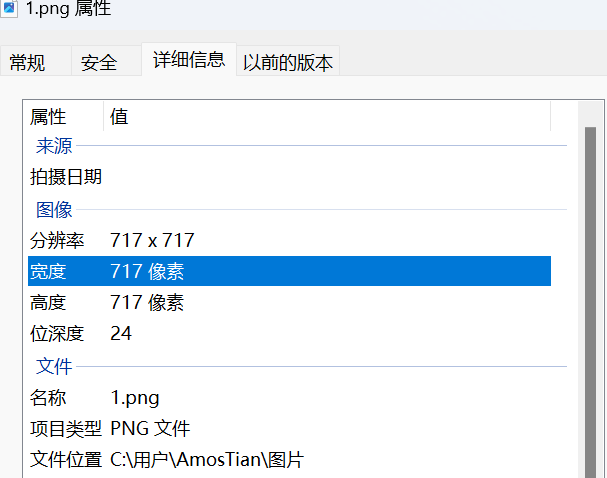
In [34]: im = np.array(Image.open("C:/Users/AmosTian/Pictures/1.png"))

In [35]: print(im.shape,im.dtype)
(717, 717, 3) uint8
# 高度axis=0
# 宽度axis=1
# RGB值axis=2
In [36]: im
Out[36]:
array([#717<高>*717<宽>*3<RGB>
[
[ 96, 116, 177],
[ 94, 114, 175],
[ 95, 115, 176],
...,
[ 61, 96, 164],
[ 62, 97, 165],
[ 59, 94, 162]
],
[ [ 97, 117, 178],
[ 94, 114, 175],
[ 95, 115, 176],
...,
[ 60, 95, 163],
[ 61, 96, 164],
[ 59, 94, 162]
],
...,
[ [ 23, 24, 22],
[ 22, 24, 22],
[ 23, 23, 26],
...,
[ 23, 46, 88],
[ 23, 46, 88],
[ 23, 46, 88]
],
[ [ 16, 18, 15],
[ 19, 21, 20],
[ 22, 23, 26],
...,
[ 19, 42, 84],
[ 20, 43, 85],
[ 21, 44, 86]
]
], dtype=uint8)

image-20231220105007664

2.5.2 图像的变换

读入图像后,获取RGB值,保存为新的文件

1
2
3
4
5
6
7
8
9
10
11
12
13
14
15
16
17
18
19
20
21
22
23
24
25
26
27
28
29
30
31
32
33
34
35
36
37
38
39
40
In [47]: from PIL import Image

In [48]: import numpy as np

In [49]: a = np.array(Image.open("C:/Users/AmosTian/Pictures/1.png"))

In [50]: a
Out[50]:
array([[[ 96, 116, 177],
[ 94, 114, 175],
[ 95, 115, 176],
...,
[ 61, 96, 164],
[ 62, 97, 165],
[ 59, 94, 162]],
...,

[[ 19, 21, 17],
[ 20, 22, 21],
[ 24, 25, 27],
...,
[ 23, 46, 88],
[ 23, 46, 88],
[ 23, 46, 88]],
[[ 16, 18, 15],
[ 19, 21, 20],
[ 22, 23, 26],
...,
[ 19, 42, 84],
[ 20, 43, 85],
[ 21, 44, 86]]], dtype=uint8)

In [51]: print(a.shape,a.dtype)
(1368, 2560, 3) uint8

In [52]: b = [255,255,255]-a

In [53]: im = Image.fromarray(b.astype('uint8'))

In [54]: im.save("C:/Users/AmosTian/Pictures/ch-1.png")

image-20231220125438850

灰度图变换

1
2
3
4
5
6
7
8
9
10
11
In [59]: from PIL import Image

In [60]: import numpy as np

In [61]: a = np.array(Image.open("C:/Users/AmosTian/Pictures/1.png").convert("L"))# 将图像导入并转换为灰度图,并将其用数组表示

In [62]: b = 255-a

In [63]: im = Image.fromarray(b.astype('uint8'))#将数组转换为图像

In [64]: im.save("C:/Users/AmosTian/Pictures/ch-2.png")

image-20231220125727055

1
2
3
4
5
In [65]: c = (100/255)*a+150

In [66]: im = Image.fromarray(c.astype('uint8'))#将数组转换为图像

In [67]: im.save("C:/Users/AmosTian/Pictures/ch-3.png")

image-20231220125927824

1
2
3
4
5
In [68]: d = 255*(a/255)**2

In [69]: im = Image.fromarray(b.astype('uint8'))#将数组转换为图像

In [70]: im.save("C:/Users/AmosTian/Pictures/ch-4.png")

image-20231220130101535

手绘效果

特征分析:

  • 黑白灰色
  • 边界线重
  • 相同或相近色彩趋于白色
  • 略有光源效果

利用像素之间的梯度值和虚拟深度值对图像进行重构,根据灰度变换来模拟人类视觉明暗程度

1
2
3
4
5
6
7
8
9
10
11
12
13
14
15
16
17
18
19
20
21
22
23
24
25
26
27
28
29
from PIL import Image
import numpy as np

a = np.array(Image.open("C:/Users/AmosTian/Pictures/1.png").convert("L")).astype('float')# 转换为灰度图像

depth=10.
grad = np.gradient(a) #取灰度图像的梯度值
grad_x,grad_y=grad #分别取横纵图像梯度值
grad_x = grad_x*depth/100. #根据深度调整x和y方向的梯度值
grad_y = grad_y*depth/100.

# 构造x和y轴梯度的三位归一化单位坐标轴
A = np.sqrt(grad_x**2 + grad_y**2 + 1.)
uni_x = grad_x/A
uni_y = grad_y/A
uni_z = 1./A

# 光源效果
vec_el = np.pi/2.2 #光源的俯视角度,弧度值
vec_az= np.pi/4. #光源的方位角度,弧度值
dx = np.cos(vec_el)*np.cos(vec_az) #光源对x轴的影响
dy = np.cos(vec_el)*np.sin(vec_az) #光源对y轴的影响
dz = np.sin(vec_el) #光源对z轴的影响
#梯度与光源相互作用,将梯度转换为灰度
b = 255*(dx*uni_x+dy*uni_y+dz*uni_z)
b.clip(0,255)

im = Image.fromarray(b.astype('uint8'))
im.save("C:/Users/AmosTian/Pictures/shouhui-1.png")

image-20231220131320649

3. Matplotlib

3.1 介绍

由各种可视化类构成,matplotlib.pyplot 是各类可视化图形的命令子库,相当于快捷方式

导入 import matplotlib.pyplot as plt

1
2
3
4
5
6
import matplotlib.pyplot as plt

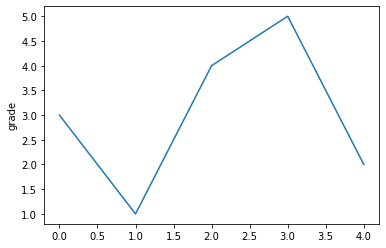
plt.plot([3,1,4,5,2])
plt.ylabel("grade")
plt.savefig('test',dpi=600) #将图片保存为文件,默认为PNG,通过dpi修改图片质量
plt.show()

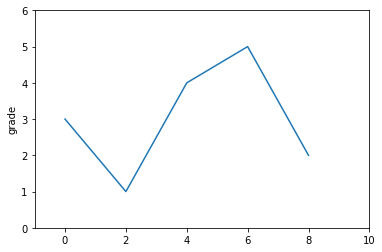
默认情况下,若输入是一维数组,则将其当做y轴数据,相应的x轴数据为其索引

image-20231220153114880

1
2
3
4
5
6
7
8
# 同时控制x,y轴的值与范围

import matplotlib.pyplot as plt

plt.plot([0,2,4,6,8],[3,1,4,5,2]) #当plot()有两个参数,arg1表示X轴,arg2表示Y轴
plt.ylabel("grade")
plt.axis([-1,10,0,6]) #-1,10表示X轴区间,0,6表示Y轴区间
plt.show()

image-20231220153603412

3.2 plot()

plt.plot(x,y,format_string,**kwargs)

  • x:X轴数据,列表或数组

  • y:Y轴数据,列表或数组

  • format_string:控制曲线的格式字符串,可选

  • **kwargs:第二组或更多(x,y,format_string)

    当绘制多条曲线时,各条曲线的参数x不能省略

1
2
3
4
5
6
7
import numpy as np
import matplotlib.pyplot as plt

a = np.arange(10)

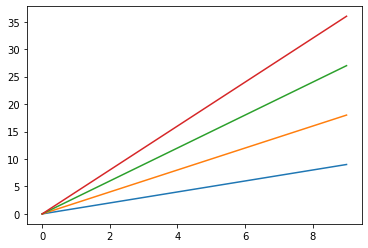
plt.plot(a,a*1,a,a*2,a,a*3,a,a*4)
plt.show()

image-20231220184304486

3.2.1 格式控制符format_string

1
2
3
4
5
6
7
import numpy as np
import matplotlib.pyplot as plt

a = np.arange(10)

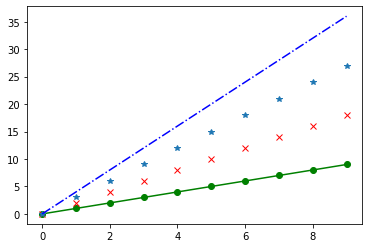
plt.plot(a,a*1,'go-',a,a*2,'rx',a,a*3,'*',a,a*4,'b-.')
plt.show()

image-20231220192758148

颜色字符

颜色字符说明
'b'蓝色
'g'绿色
'r'红色
'c'青绿色cyan
'm'洋红色 magenta
'y'黄色
'k'黑色
'w'白色
'#008000'RGB颜色
'0.8'灰度值字符串

点标记

标记字符说明
.点标记
,像素标记(极小点)
o实心圈标记
v倒三角标记
^上三角标记
>右三角标记
<左三角标记
1下花三角标记
2上花三角标记
3左花三角标记
4右花三角标记
s实心方形标记
p实心五角标记
*星形标记
h竖六边形标记
H横六边形标记
+十字标记
xx标记
D菱形标记
d瘦菱形标记
``垂直线标记

风格字符

风格字符说明
'-'实线
'--'破折线
'-.'点划线
':'虚线
''''无线条

3.2.2 其他格式控制符

关键字参数说明
color='green'控制颜色
linestyle='dashed'线条风格
marker='0'标记风格
markerfacecolor='blue'标记颜色
markersize=20标记尺寸

3.3 中文显示

pyplot不支持中文,需要引入第三方库

3.3.1 改变matplot的全局字体

matplotlib.rcParams[] 可用于修改全局字体样式

1
2
3
4
5
6
7
import matplotlib.pyplot as plt
import matplotlib

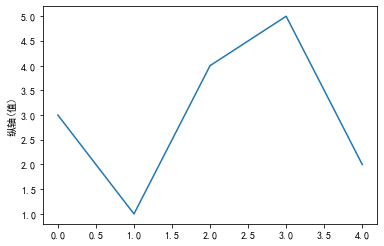
matplotlib.rcParams['font.family']='SimHei'
plt.plot([3,1,4,5,2])
plt.ylabel("纵轴(值)")
plt.show()

image-20231220194350568

rcParams属性

属性说明
'font.family'用于显示字体名
'font.style'字体风格,正常 'normal' 或斜体 'italic'
'font.size'字体大小,整数字号或 'large''x-small'
字体备选值
中文字体名说明·
'SimHei'黑体
'Kaiti'楷体
'LiSu'隶书
'FangSong'仿宋
'YouYuann'幼圆
'STSong'华文宋体
1
2
3
4
5
6
7
8
9
10
11
12
13
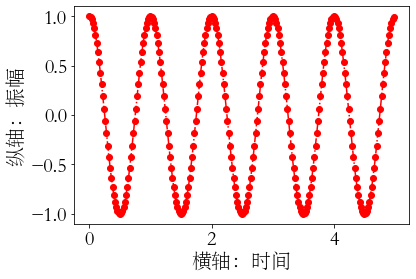
import matplotlib.pyplot as plt
import matplotlib
import numpy as np

matplotlib.rcParams['font.family']='STSong'
matplotlib.rcParams['font.size']=20

a = np.arange(0.0,5.0,0.02)

plt.xlabel('横轴:时间')
plt.ylabel("纵轴:振幅")
plt.plot(a,np.cos(2*np.pi*a),'ro-.')
plt.show()

image-20231220195053946

3.3.2 通过标签的局部属性

1
2
3
4
5
6
7
8
9
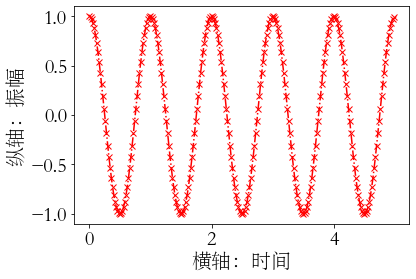
import matplotlib.pyplot as plt
import numpy as np

a = np.arange(0.0,5.0,0.02)

plt.xlabel('横轴:时间',fontproperties='STSong',fontsize=20)
plt.ylabel("纵轴:振幅",fontproperties='STSong',fontsize=20)
plt.plot(a,np.cos(2*np.pi*a),'rx-.')
plt.show()

image-20231220195331337

3.4 文本显示

函数说明
plt.xlabel()对X轴增加文本标签
plt.ylabel()对Y轴增加文本标签
plt.title()对图形整体增加文本标题
plt.annotate()在图形中增加带箭头的注解
1
2
3
4
5
6
7
8
9
10
11
12
13
14
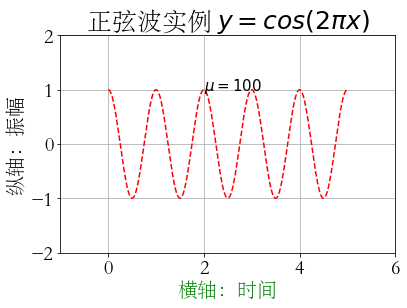
import matplotlib.pyplot as plt
import numpy as np

a = np.arange(0.0,5.0,0.02)

plt.plot(a,np.cos(2*np.pi*a),'r--')
plt.xlabel('横轴:时间',fontproperties='STSong',fontsize=20,color='green')
plt.ylabel("纵轴:振幅",fontproperties='STSong',fontsize=20)
plt.title(r'正弦波实例 $y=cos(2\pi x)$',fontproperties='STSong',fontsize=25)
plt.text(2,1,r'$\mu=100$',fontsize=15)

plt.axis([-1,6,-2,2])
plt.grid(True)
plt.show()

image-20231220201616534

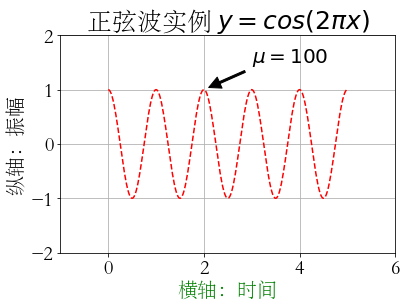
带箭头注解

plt.annotate(text,xy=arrow_crd_tuple,xytext=text_crd_tuple,arrowprops=dict())

1
2
3
4
5
6
7
8
9
10
11
12
13
14
import matplotlib.pyplot as plt
import numpy as np

a = np.arange(0.0,5.0,0.02)

plt.plot(a,np.cos(2*np.pi*a),'r--')
plt.xlabel('横轴:时间',fontproperties='STSong',fontsize=20,color='green')
plt.ylabel("纵轴:振幅",fontproperties='STSong',fontsize=20)
plt.title(r'正弦波实例 $y=cos(2\pi x)$',fontproperties='STSong',fontsize=25)
plt.annotate(r'$\mu=100$',xy=(2,1),xytext=(3,1.5),arrowprops=dict(facecolor='black',shrink=0.1,width=2))# shrink表示箭头两侧的空白间距

plt.axis([-1,6,-2,2])
plt.grid(True)
plt.show()

image-20231220203018464

3.5 子绘图区域

3.5.1 subplot

plt.subplot(nrows,ncols,plot_number) :在全局绘图区创建一个分区体系,并定位到 plot_number 指定的子绘图区域

plt.subplot(3,2,4)
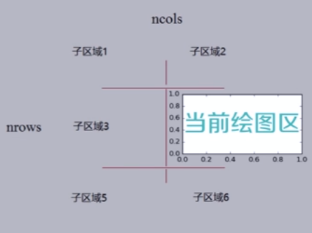
image-20231220153945211

1
2
3
4
5
6
7
8
9
10
11
12
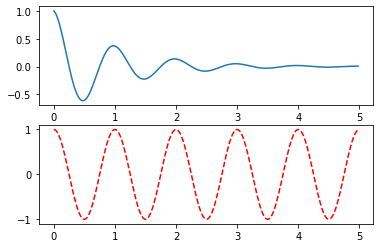
import numpy as np
import matplotlib.pyplot as plt
def f(t):
return np.exp(-t) * np.cos(2*np.pi*t)

a = np.arange(0.0, 5.0, 0.02)
plt.subplot(211)
plt.plot(a,f(a))

plt.subplot(2,1,2)
plt.plot(a, np.cos(2*np.pi*a),'r--')
plt.show()

image-20231220154514051

3.5.2 subplot2grid

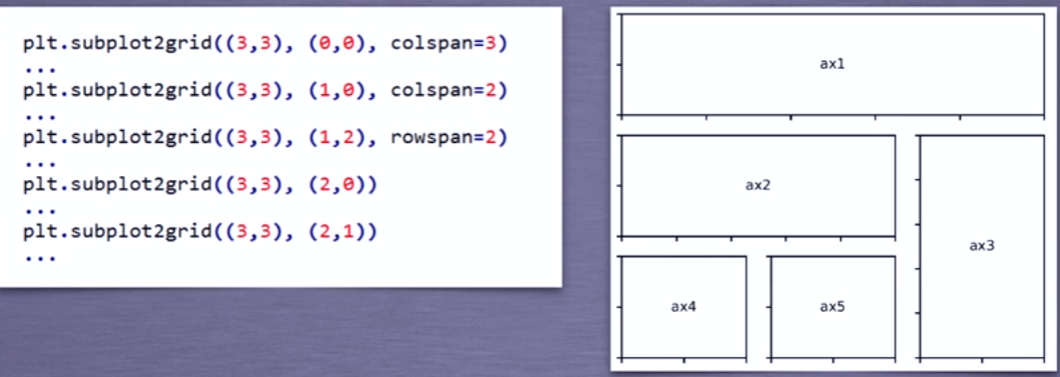
理念:设计网格,选中网格,确定选中行列区域数量,网格编号从0开始

plt.subplot2grid(gridSpec,CurSpec,colspan=1,rowspan=1)

1
plt.subplot2grid((3,3),(0,0),colspan=3) #表示将绘图区域分为3*3=9个网格,选中从(0.0)开始的网格,占3列网格

image-20231220204905632

3.5.3 gridspec类

1
2
3
4
5
6
7
8
9
import matplotlib.gridspec as gridspec

gs = gridspec.GridSpec(3,3)

ax1 = plt.subplot(gs[0,:]) #横向第0行,纵向全部列
ax2 = plt.subplot(gs[1,:-1]) #横向第1行,纵向到最后一列,但不包括最后一列
ax3 = plt.subplot(gs[1:,-1]) #横向第一行开始到结束,纵向最后一列
ax4 = plt.subplot(gs[2,0]) #横向第二行,纵向第1列
ax5 = plt.subplot(gs[21]) #横向第2行,纵向第一列

3.6 pyplot图表绘制函数

函数说明
plt.plot(x,y,fmt,...)绘制坐标图
plt.boxplot(data,notch,position)绘制箱形图
plt.bar(left,height,width,bottom)绘制条形图
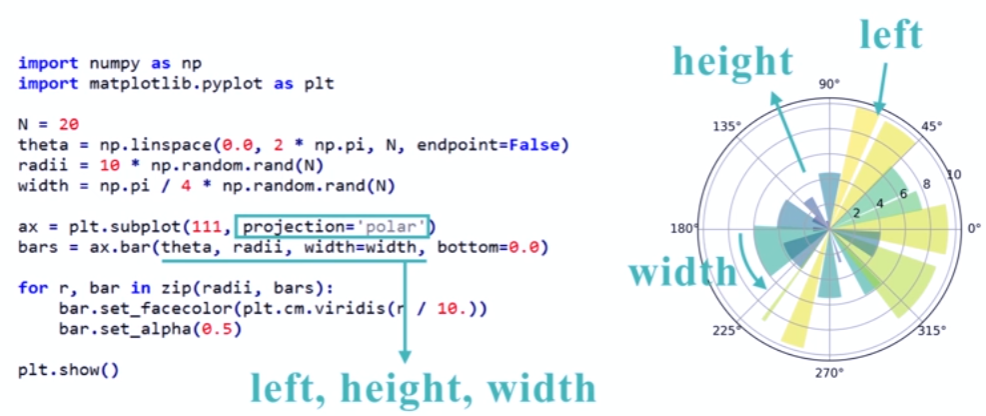
plt.barh(width,bottom,left,height)横向条形图
plt.polar(theta,r)极坐标图
plt.pie(data,explode)饼图
plt.psd(x,NFFT=256,pad_to,Fs)功率谱密度图
plt.specgram(x,NFFT=256,pad_to,F)谱图
plt.cohere(x,y,NFFT=256,Fs)X-Y的相关性图像
plt.scatter(x,y)散点图,x和y相同
plt.step(x,y,where)步阶图
plt.hist(x,bins,normed)直方图
plt.contour(X,Y,Z,N)等值图
plt.vlines()垂直图
plt.stem(x,y,linefmt,markerfmt)柴火图
plt.plot_date()数据日期

3.6.1 饼图

1
2
3
4
5
6
7
8
9
10
11
12
13
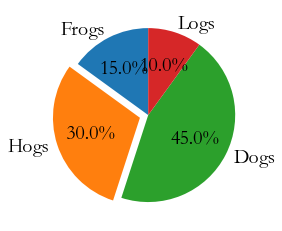
import matplotlib.pyplot as plt

labels = 'Frogs','Hogs','Dogs','Logs'
sizes = [15,30,45,10]
explode = (0,0.1,0,0)

plt.pie(sizes,explode=explode,labels=labels,autopct='%1.1f%%',shadow=False,startangle=90)
# sizes:各部分数据
# explode:各部分突出程度
# labels:各部分标签
# autopic:各部分百分数显示方式
# startangle:起始角度
plt.show()

image-20231220212040014

3.6.2 直方图

1
2
3
4
5
6
7
8
9
10
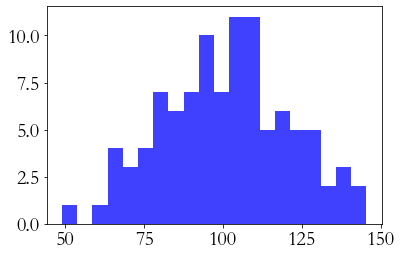
import numpy as np
import matplotlib.pyplot as plt

np.random.seed(0)
mu,sigma = 100,20
a = np.random.normal(mu,sigma,size=100)
plt.hist(a,20,histtype='stepfilled',facecolor='b',alpha=0.75)
#bins:表示直方图中直方的个数,即区间等分的个数

plt.show()

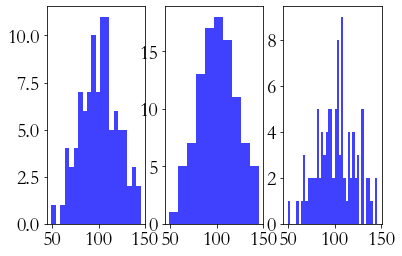
image-20231220213051603

1
2
3
4
5
6
7
8
9
10
11
12
13
14
15
16
17
18
19
20
21
22
23
24
25
26
import numpy as np
import matplotlib.pyplot as plt
import matplotlib.gridspec as gridspec

gs = gridspec.GridSpec(1,3)

plt.subplot(gs[0,0])
np.random.seed(0)
mu,sigma = 100,20
a = np.random.normal(mu,sigma,size=100)
plt.hist(a,20,histtype='stepfilled',facecolor='b',alpha=0.75)


plt.subplot(gs[0,1])
np.random.seed(0)
mu,sigma = 100,20
a = np.random.normal(mu,sigma,size=100)
plt.hist(a,10,histtype='stepfilled',facecolor='b',alpha=0.75)

plt.subplot(gs[0,2])
np.random.seed(0)
mu,sigma = 100,20
a = np.random.normal(mu,sigma,size=100)
plt.hist(a,40,histtype='stepfilled',facecolor='b',alpha=0.75)

plt.show()

image-20231220213414899

3.6.3 极坐标绘制

image-20231220214121371

3.6.4 散点图

image-20231220214426612

4. pandas

提供高性能易用数据类型和分析工具

  • 便于操作数据的数据类型——数据表示

    基于ndarray的数据类型:Seies(一维数据类型),DataFrame(多维数据类型)

  • 提供数据的分析函数和分析工具——数据分析

    基本操作

    运算操作

    特征类操作

    关联类操作

import pandas as pd

  • Pandas基于NumPy实现,常与NumPy和Matplotlib一起使用
NumPyPandas
基础数据类型扩展数据类型
关注数据的结构表达(数据如何存储为变量)关注数据的应用表达
维度:数据间关系数据与索引间关系

4.1 数据类型

4.1.1 Series类型

Series=index+values

  • index为Index类型,values为ndarray类型
  • Series会为每个数据关联索引,可以是自动索引(从0开始);也可以是自定义索引
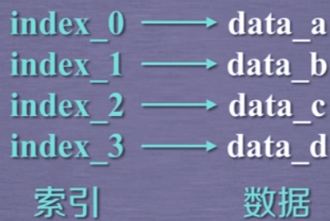
image-20231221100343908

1
2
3
4
5
6
7
8
9
10
11
12
13
14
In [1]: import pandas as pd

In [2]: a = pd.Series([9,8,7,6,1,2])

In [3]: a
Out[3]:
0 9
1 8
2 7
3 6
dtype: int64

#左侧列为自动索引
#NumPy中的数据类型

支持自定义索引

1
2
3
4
5
6
7
8
9
In [5]: a = pd.Series([9,8,7,6],index = ['a','b','c','d'])

In [6]: a
Out[6]:
a 9
b 8
c 7
d 6
dtype: int64

创建

  • 列表创建:index与列表元素个数一致,index缺省则生成自动索引
  • 标量创建:index表述Series类型的尺寸,index不能缺省
  • 字典创建:字典的“键”是index,自定义index从字典中选择值
  • ndarray创建:索引和数据都可以通过ndarray类型创建
标量创建

标量创建,则索引不能省略 :Series几个元素构成,需要由索引信息给出

1
2
3
4
5
6
7
8
In [9]: s = pd.Series(5,index=['a','b','c'])

In [10]: s
Out[10]:
a 5
b 5
c 5
dtype: int64
字典创建
1
2
3
4
5
6
7
8
In [11]: s = pd.Series({'a':9,'c':8,'e':7})

In [12]: s
Out[12]:
a 9
c 8
e 7
dtype: int64

可以通过自定义索引从字典搜索对应值

1
2
3
4
5
6
7
8
9
10
In [13]: s = pd.Series({'a':9,'c':8,'e':7},index=['a','b','c','d','e'])

In [14]: s
Out[14]:
a 9.0
b NaN
c 8.0
d NaN
e 7.0
dtype: float64
ndarray创建
1
2
3
4
5
6
7
8
9
10
In [16]: n = pd.Series(np.arange(5),index=np.arange(9,4,-1))

In [17]: n
Out[17]:
9 0
8 1
7 2
6 3
5 4
dtype: int32

基本操作

Series整体类似于字典操作,对于values的操作类似与ndarray操作

1
2
3
4
5
6
7
8
9
10
11
12
13
14
15
In [18]: b = pd.Series([9,8,7,6],index=['c','a','d','b'])

In [19]: b
Out[19]:
c 9
a 8
d 7
b 6
dtype: int64

In [20]: b.index #获取index,输出类型为Index类型
Out[20]: Index(['c', 'a', 'd', 'b'], dtype='object')

In [21]: b.values #获取values,输出类型为ndarray类型
Out[21]: array([9, 8, 7, 6], dtype=int64)

自动索引与自定义索引并存,但一个操作中不能混用两种索引方式

1
2
3
4
5
6
7
8
9
10
11
12
13
14
15
16
17
18
19
20
21
22
23
In [28]: b[2]
Out[28]: 7

In [29]: b['d']
Out[29]: 7

In [30]: b[['c','d','a']]
Out[30]:
c 9
d 7
a 8
dtype: int64

In [31]: b[['c','d',0]]
Traceback (most recent call last):

Cell In[31], line 1
b[['c','d',0]]

File D:\anaconda3\lib\site-packages\pandas\core\indexes\base.py:5941 in _raise_if_missing
raise KeyError(f"{not_found} not in index")

KeyError: '[0] not in index'
类似于ndarray的操作
  • 索引方式都是 []
  • 运算和操作可用于Series类型
  • 可通过自定义索引的列表进行切片
  • 可通过自动索引进行切片,若存在自定义索引,则一同被切片
1
2
3
4
5
6
7
8
9
10
11
12
13
14
15
16
17
18
19
20
21
22
23
24
25
26
27
28
29
30
31
In [32]: b
Out[32]:
c 9
a 8
d 7
b 6
dtype: int64

In [33]: b[3]
Out[33]: 6

In [34]: b[:3]
Out[34]:
c 9
a 8
d 7
dtype: int64

In [35]: b[b>b.median()]
Out[35]:
c 9
a 8
dtype: int64

In [36]: np.exp(b)
Out[36]:
c 8103.083928
a 2980.957987
d 1096.633158
b 403.428793
dtype: float64
类似于字典的操作
  • 通过自定义索引访问
  • 保留字 in 操作:判断键是否在自定义索引列表中
  • 使用 .get(arg1,arg2) 方法:根据arg1(键)提取值,若不存在则返回arg2
1
2
3
4
5
6
7
8
9
10
11
12
13
14
15
16
17
18
19
In [37]: b
Out[37]:
c 9
a 8
d 7
b 6
dtype: int64

In [38]: b['b']
Out[38]: 6

In [39]: 'c' in b
Out[39]: True

In [40]: 0 in b
Out[40]: False

In [41]: b.get('f',-1)
Out[41]: -1
索引对齐操作

Series+Series:在运算过程中会自动对齐相同索引的数据

1
2
3
4
5
6
7
8
9
10
11
12
In [44]: a = pd.Series([1,2,3],index=['c','b','e'])

In [45]: b = pd.Series([9,8,7,6],index=['a','b','c','d'])

In [46]: a+b
Out[46]:
a NaN
b 10.0
c 8.0
d NaN
e NaN
dtype: float64

Series类型的name属性

Series对象和索引都可以有一个名字,存在 .name

1
2
3
4
5
6
7
8
9
10
11
12
In [48]: b.name='Series对象'

In [49]: b.index.name='索引名'

In [50]: b
Out[50]:
索引名
a 9
b 8
c 7
d 6
Name: Series对象, dtype: int64

修改

Series对象可以随时修改并即刻生效

1
2
3
4
5
6
7
8
9
10
11
12
13
14
15
16
17
18
19
20
21
22
23
24
25
26
27
28
29
30
31
32
33
34
35
36
37
38
39
40
41
In [51]: b
Out[51]:
索引名
a 9
b 8
c 7
d 6
Name: Series对象, dtype: int64

In [52]: b.name='New name'

In [53]: b
Out[53]:
索引名
a 9
b 8
c 7
d 6
Name: New name, dtype: int64

In [54]: b['a']=10

In [55]: b
Out[55]:
索引名
a 10
b 8
c 7
d 6
Name: New name, dtype: int64

In [57]: b[['b','c']]=20

In [58]: b
Out[58]:
索引名
a 10
b 20
c 20
d 6
Name: New name, dtype: int64

4.1.2 DataFrame

DataFrame=行列索引+二维数据

由共用相同索引的一组列组成,每列值类型可以不同

image-20231221110113356

创建

  • 二维ndarray对象
  • 由一维ndarray、列表、字典、元组或Series构成的字典
  • Series类型
  • 其他DataFrame类型
ndarray创建
1
2
3
4
5
6
7
In [61]: d = pd.DataFrame(np.arange(10).reshape(2,5))

In [62]: d
Out[62]:
0 1 2 3 4
0 0 1 2 3 4
1 5 6 7 8 9

生成自动行索引与自动列索引

字典+Series创建
  • 将字典中的键转换为列索引,index为行索引
1
2
3
4
5
6
7
8
9
10
11
12
13
In [74]: dct={'one':pd.Series([1,2,3],index=['a','b','c']),
...: 'two':pd.Series([9,8,7,6],index=['a','b','c','d'])}

In [75]: d = pd.DataFrame(dct)

In [76]: d
Out[76]:
one two#列索引 columns
a 1.0 9
b 2.0 8
c 3.0 7
d NaN 6
#行索引index

字典中数据根据行索引index和列索引columns自动补齐

1
2
3
4
5
6
In [79]: pd.DataFrame(dct,index=['b','c','d'],columns=['two','three'])
Out[79]:
two three
b 8 NaN
c 7 NaN
d 6 NaN
字典+列表
1
2
3
4
5
6
7
8
9
10
11
In [80]: dl = {'one':[1,2,3,4],'two':[9,8,7,6]}

In [81]: d = pd.DataFrame(dl,index=['a','b','c','d'])

In [82]: d
Out[82]:
one two
a 1 9
b 2 8
c 3 7
d 4 6

基本操作

1
2
3
4
5
6
7
8
9
10
11
12
13
14
15
16
17
18
19
20
21
22
23
24
25
26
27
28
In [88]: dl = {"环比":[101.5,101.2,101.3,102.0,100.1],
...: "同比":[120.7,127.3,119.4,140.9,101.4],
...: "定基":[121.4,127.8,120.0,145.5,101.6]}

In [89]: d = pd.DataFrame(dl,index=["北京","上海","广州","深圳","沈阳"])

In [90]: d
Out[90]:
环比 同比 定基
北京 101.5 120.7 121.4
上海 101.2 127.3 127.8
广州 101.3 119.4 120.0
深圳 102.0 140.9 145.5
沈阳 100.1 101.4 101.6

In [91]: d.index
Out[91]: Index(['北京', '上海', '广州', '深圳', '沈阳'], dtype='object')

In [92]: d.columns
Out[92]: Index(['环比', '同比', '定基'], dtype='object')

In [93]: d.values
Out[93]:
array([[101.5, 120.7, 121.4],
[101.2, 127.3, 127.8],
[101.3, 119.4, 120. ],
[102. , 140.9, 145.5],
[100.1, 101.4, 101.6]])
索引获取数据

DF.列索引 :获取指定列数据

DF.行索引 :获取指定行索引

1
2
3
4
5
6
7
8
9
10
11
12
13
14
15
16
17
18
In [114]: d["同比"]
Out[114]:
北京 120.7
上海 127.3
广州 119.4
深圳 140.9
沈阳 101.4
Name: 同比, dtype: float64

In [115]: d.loc["上海"]
Out[115]:
环比 101.2
同比 127.3
定基 127.8
Name: 上海, dtype: float64

In [116]: d["同比"]["上海"]
Out[116]: 127.3

DataFrame索引方式为,先通过列索引(键)获取某一列数据(某个Series),再通过行索引(index)获取 Series 中的某个数据

4.2 数据类型操作

操作索引即操作数据

  • 重新索引:增加或重排索引 obj.reindex()
  • 数据删除:drop
  • 算术运算
  • 比较运算

4.2.1 索引操作

重新索引

1
2
3
4
5
6
7
8
9
10
11
12
13
14
15
16
17
18
19
20
21
22
23
24
25
26
In [117]: d
Out[117]:
环比 同比 定基
北京 101.5 120.7 121.4
上海 101.2 127.3 127.8
广州 101.3 119.4 120.0
深圳 102.0 140.9 145.5
沈阳 100.1 101.4 101.6

In [118]: d.reindex(index=['上海','广州','北京','深圳','沈阳'])
Out[118]:
环比 同比 定基
上海 101.2 127.3 127.8
广州 101.3 119.4 120.0
北京 101.5 120.7 121.4
深圳 102.0 140.9 145.5
沈阳 100.1 101.4 101.6

In [119]: d.reindex(columns=["同比",'环比','定基'])
Out[119]:
同比 环比 定基
北京 120.7 101.5 121.4
上海 127.3 101.2 127.8
广州 119.4 101.3 120.0
深圳 140.9 102.0 145.5
沈阳 101.4 100.1 101.6

obj.reindex(index,columns,fill_value,method,limit,copy)

  • index:重排后的行索引列表——Index类型
  • columns:重排后的列索引列表——Index类型
  • fill_value:填充缺失位置的值——int或int列表
  • method:”ffill”:当前值由前值填充,”bfill”:当前值由后值填充
  • limit:最大填充量
  • copy:默认True,生成新的对象;False,新旧相等不复制

索引类型操作

DataFrame中的行索引和列索引类型都是 Index,Index对象是不可修改类型

方法说明
idx.append(Index)连接另一个Index对象,产生新的Index对象
idx.diff(Index)计算差集,产生新的Index对象
idx.intersection(Index)计算交集
idx.union(Index)计算并集
idx.delete(loc)删除loc位置的元素,loc:int或list of int
idx.insert(loc,e)在loc位置插入一个元素e
插入新列
1
2
3
4
5
6
7
8
9
10
11
12
13
14
15
In [120]: newc = d.columns.insert(3,"新增") #生成新的Series

In [123]: newc
Out[123]: Index(['环比', '同比', '定基', '新增'], dtype='object')

In [121]: newd = d.reindex(columns=newc,fill_value=200)

In [122]: newd
Out[122]:
环比 同比 定基 新增
北京 101.5 120.7 121.4 200
上海 101.2 127.3 127.8 200
广州 101.3 119.4 120.0 200
深圳 102.0 140.9 145.5 200
沈阳 100.1 101.4 101.6 200
删除列
1
2
3
4
5
6
7
8
9
10
11
In [134]: newd
Out[134]:
环比 同比 定基 新增
北京 101.5 120.7 121.4 200
上海 101.2 127.3 127.8 200
广州 101.3 119.4 120.0 200
深圳 102.0 140.9 145.5 200
沈阳 100.1 101.4 101.6 200

In [135]: newd.columns.delete(3)
Out[135]: Index(['环比', '同比', '定基'], dtype='object')
插入行
1
2
3
4
5
6
7
8
9
10
11
12
13
14
15
16
17
18
19
20
21
In [165]: newdf = newd.reindex(index=newd.index.insert(5,"newrow"),columns=newd.columns.delete(1))

In [166]: newdf
Out[166]:
环比 定基 新增
北京 101.5 121.4 200.0
上海 101.2 127.8 200.0
广州 101.3 120.0 200.0
深圳 102.0 145.5 200.0
沈阳 100.1 101.6 200.0
newrow NaN NaN NaN

In [167]: newdf.ffill()
Out[167]:
环比 定基 新增
北京 101.5 121.4 200.0
上海 101.2 127.8 200.0
广州 101.3 120.0 200.0
深圳 102.0 145.5 200.0
沈阳 100.1 101.6 200.0
newrow 100.1 101.6 200.0
.drop()

.drop() 删除Series和DataFrame指定行或列索引

1
2
3
4
5
6
7
8
9
10
11
12
13
14
15
In [172]: a = pd.Series([9,8,7,6],index=['a','b','c','d'])

In [173]: a
Out[173]:
a 9
b 8
c 7
d 6
dtype: int64

In [174]: a.drop(['b','d'])
Out[174]:
a 9
c 7
dtype: int64
1
2
3
4
5
6
7
8
9
10
11
12
13
14
15
16
17
18
19
20
21
22
23
24
25
26
27
28
29
30
31
In [175]: dl = {"环比":[101.5,101.2,101.3,102.0,100.1],
...: "同比":[120.7,127.3,119.4,140.9,101.4],
...: "定基":[121.4,127.8,120.0,145.5,101.6]}

In [176]: d = pd.DataFrame(dl,index=["北京","上海","广州","深圳","沈阳"])

In [177]: d
Out[177]:
环比 同比 定基
北京 101.5 120.7 121.4
上海 101.2 127.3 127.8
广州 101.3 119.4 120.0
深圳 102.0 140.9 145.5
沈阳 100.1 101.4 101.6

In [178]: d.drop("北京")
Out[178]:
环比 同比 定基
上海 101.2 127.3 127.8
广州 101.3 119.4 120.0
深圳 102.0 140.9 145.5
沈阳 100.1 101.4 101.6

In [179]: d.drop("同比",axis=1) # 删除键,则需要指定1轴
Out[179]:
环比 定基
北京 101.5 121.4
上海 101.2 127.8
广州 101.3 120.0
深圳 102.0 145.5
沈阳 100.1 101.6

4.2.2 数据类型运算

算术运算

  • 同秩数据:先进行索引对齐(NaN填充),对齐后相同行索引才进行运算,默认产生浮点数
  • 异秩数据:广播运算,低维数据会作用到高维数据的每个元素上
方法说明
.add(d,fill_value,axis)加法运算
.sub(d,**args)减法运算
.mul(d,**args)乘法运算
.div(d,**args)除法运算
同秩运算

四则运算产生新的对象

1
2
3
4
5
6
7
8
9
10
11
12
13
14
15
16
17
18
19
20
21
22
23
24
25
26
In [183]: a = pd.DataFrame(np.arange(12).reshape(3,4))

In [184]: a
Out[184]:
0 1 2 3
0 0 1 2 3
1 4 5 6 7
2 8 9 10 11

In [185]: b = pd.DataFrame(np.arange(20).reshape(4,5))

In [186]: b
Out[186]:
0 1 2 3 4
0 0 1 2 3 4
1 5 6 7 8 9
2 10 11 12 13 14
3 15 16 17 18 19

In [187]: a+b
Out[187]:
0 1 2 3 4
0 0.0 2.0 4.0 6.0 NaN
1 9.0 11.0 13.0 15.0 NaN
2 18.0 20.0 22.0 24.0 NaN
3 NaN NaN NaN NaN NaN

同秩但维度不同,消除NaN

1
2
3
4
5
6
7
In [188]:  b.add(a,fill_value=100)
Out[188]:
0 1 2 3 4
0 0.0 2.0 4.0 6.0 104.0
1 9.0 11.0 13.0 15.0 109.0
2 18.0 20.0 22.0 24.0 114.0
3 115.0 116.0 117.0 118.0 119.0
异秩运算

需要调用函数进行四则运算

不同维度间广播运算,二维与一维的运算默认发生在1轴上

1
2
3
4
5
6
7
8
9
10
11
12
13
14
15
16
17
18
19
20
21
22
23
24
25
26
27
28
29
30
31
32
33
In [192]: c = pd.Series(np.arange(4))

In [193]: c
Out[193]:
0 0
1 1
2 2
3 3
dtype: int32

In [194]: c-10
Out[194]:
0 -10
1 -9
2 -8
3 -7
dtype: int32

In [191]: b
Out[191]:
0 1 2 3 4
0 0 1 2 3 4
1 5 6 7 8 9
2 10 11 12 13 14
3 15 16 17 18 19

In [195]: b-c
Out[195]:
0 1 2 3 4
0 0.0 0.0 0.0 0.0 NaN
1 5.0 5.0 5.0 5.0 NaN
2 10.0 10.0 10.0 10.0 NaN
3 15.0 15.0 15.0 15.0 NaN

可以通过四则运算方法的 axis 指定参与运算的轴

1
2
3
4
5
6
7
In [196]: b.sub(c,axis=0)
Out[196]:
0 1 2 3 4
0 0 1 2 3 4
1 4 5 6 7 8
2 8 9 10 11 12
3 12 13 14 15 16

比较运算

只能比较相同索引的运算,不进行补齐,即必须是同尺寸比较

不同秩相同尺寸之间的运算为广播运算

采用 >,<,> =,< =,! = ,== 进行二元运算产生布尔对象

1
2
3
4
5
6
7
8
9
10
11
12
13
14
15
16
17
18
19
20
21
22
23
24
25
26
27
28
29
In [199]: a
Out[199]:
0 1 2 3
0 0 1 2 3
1 4 5 6 7
2 8 9 10 11

In [200]: d = pd.DataFrame(np.arange(12,0,-1).reshape(3,4))

In [201]: d
Out[201]:
0 1 2 3
0 12 11 10 9
1 8 7 6 5
2 4 3 2 1

In [202]: a > d
Out[202]:
0 1 2 3
0 False False False False
1 False False False True
2 True True True True

In [203]: a == d
Out[203]:
0 1 2 3
0 False False False False
1 False False True False
2 False False False False
异秩同尺寸
1
2
3
4
5
6
7
8
9
10
11
12
13
14
15
16
17
18
19
20
21
22
23
24
25
26
27
28
29
30
31
In [204]: a
Out[204]:
0 1 2 3
0 0 1 2 3
1 4 5 6 7
2 8 9 10 11

In [205]: c = pd.Series(np.arange(4))

In [206]: c
Out[206]:
0 0
1 1
2 2
3 3
dtype: int32

In [207]: a > c
Out[207]:
0 1 2 3
0 False False False False
1 True True True True
2 True True True True

In [208]: c > 0
Out[208]:
0 False
1 True
2 True
3 True
dtype: bool

4.3 数据操作

4.3.1 数据排序

  • 索引排序
  • 值排序

索引排序

obj.sort_index(axis=,ascending=True) 在指定轴上进行排序,默认升序

1
2
3
4
5
6
7
8
9
10
11
12
13
14
15
16
17
18
19
20
21
22
23
24
25
26
27
28
29
30
31
32
33
In [212]: b = pd.DataFrame(np.arange(20).reshape(4,5),index=['c','a','b','d'])

In [213]: b
Out[213]:
0 1 2 3 4
c 0 1 2 3 4
a 5 6 7 8 9
b 10 11 12 13 14
d 15 16 17 18 19

In [214]: b.sort_index()
Out[214]:
0 1 2 3 4
a 5 6 7 8 9
b 10 11 12 13 14
c 0 1 2 3 4
d 15 16 17 18 19

In [215]: b.sort_index(ascending=False)
Out[215]:
0 1 2 3 4
d 15 16 17 18 19
c 0 1 2 3 4
b 10 11 12 13 14
a 5 6 7 8 9

In [216]: b.sort_index(axis=1,ascending=False)
Out[216]:
4 3 2 1 0
c 4 3 2 1 0
a 9 8 7 6 5
b 14 13 12 11 10
d 19 18 17 16 15

值排序

Series.sort_values(axis=0,ascending=True) 指定轴上的数据,默认对0轴元素升序

DataFrame.sort_values(by,axis=0,ascending=Trye) 指定键上0轴升序排序

1
2
3
4
5
6
7
8
9
10
11
12
13
14
15
16
17
18
19
20
21
22
23
In [217]: b
Out[217]:
0 1 2 3 4
c 0 1 2 3 4
a 5 6 7 8 9
b 10 11 12 13 14
d 15 16 17 18 19

In [218]: b.sort_values(2,ascending=False)
Out[218]:
0 1 2 3 4
d 15 16 17 18 19
b 10 11 12 13 14
a 5 6 7 8 9
c 0 1 2 3 4

In [219]: b.sort_values('a',axis=1,ascending=False)
Out[219]:
4 3 2 1 0
c 4 3 2 1 0
a 9 8 7 6 5
b 14 13 12 11 10
d 19 18 17 16 15

NaN统一放在排序末尾

1
2
3
4
5
6
7
8
9
10
11
12
13
14
15
16
17
18
19
20
21
22
23
24
25
26
27
28
29
30
31
32
33
34
35
In [227]: b
Out[227]:
0 1 2 3 4
c 0 1 2 3 4
a 5 6 7 8 9
b 10 11 12 13 14
d 15 16 17 18 19

In [228]: a = pd.DataFrame(np.arange(12).reshape(3,4),index=['a','b','c'])

In [229]: c = a+b

In [230]: c
Out[230]:
0 1 2 3 4
a 5.0 7.0 9.0 11.0 NaN
b 14.0 16.0 18.0 20.0 NaN
c 8.0 10.0 12.0 14.0 NaN
d NaN NaN NaN NaN NaN

In [231]: c.sort_values(2,ascending=False)
Out[231]:
0 1 2 3 4
b 14.0 16.0 18.0 20.0 NaN
c 8.0 10.0 12.0 14.0 NaN
a 5.0 7.0 9.0 11.0 NaN
d NaN NaN NaN NaN NaN

In [232]: c.sort_values('a',axis=1,ascending=False)
Out[232]:
3 2 1 0 4
a 11.0 9.0 7.0 5.0 NaN
b 20.0 18.0 16.0 14.0 NaN
c 14.0 12.0 10.0 8.0 NaN
d NaN NaN NaN NaN NaN

4.3.2 基本统计分析

基本统计方法

方法说明
.sum()计算数据的总和,按0轴算
.count()非NaN值的数量
.mean() .median()计算数据的算术平均值、算术中位数
.var() .std()计算数据的方差、标准差
.min() .max()计算数据的最小值、最大值

.describe() :针对0轴的统计信息汇总

1
2
3
4
5
6
7
8
9
10
11
12
13
14
15
16
17
18
19
20
21
22
In [237]: a = pd.Series(np.arange(4))

In [238]: a.describe()
Out[238]:
count 4.000000
mean 1.500000
std 1.290994
min 0.000000
25% 0.750000
50% 1.500000
75% 2.250000
max 3.000000
dtype: float64

In [239]: type(a.describe())
Out[239]: pandas.core.series.Series

In [240]: a.describe()['count']
Out[240]: 4.0

In [241]: a.describe()['max']
Out[241]: 3.0
1
2
3
4
5
6
7
8
9
10
11
12
13
14
15
16
17
18
19
20
21
22
23
24
25
26
27
28
29
30
31
32
33
34
35
36
37
38
39
40
In [234]: b
Out[234]:
0 1 2 3 4
c 0 1 2 3 4
a 5 6 7 8 9
b 10 11 12 13 14
d 15 16 17 18 19

In [235]: b.describe()
Out[235]:
0 1 2 3 4
count 4.000000 4.000000 4.000000 4.000000 4.000000
mean 7.500000 8.500000 9.500000 10.500000 11.500000
std 6.454972 6.454972 6.454972 6.454972 6.454972
min 0.000000 1.000000 2.000000 3.000000 4.000000
25% 3.750000 4.750000 5.750000 6.750000 7.750000
50% 7.500000 8.500000 9.500000 10.500000 11.500000
75% 11.250000 12.250000 13.250000 14.250000 15.250000
max 15.000000 16.000000 17.000000 18.000000 19.000000

In [243]: b.describe().loc['max']
Out[243]:
0 15.0
1 16.0
2 17.0
3 18.0
4 19.0
Name: max, dtype: float64

In [244]: b.describe()[2]
Out[244]:
count 4.000000
mean 9.500000
std 6.454972
min 2.000000
25% 5.750000
50% 9.500000
75% 13.250000
max 17.000000
Name: 2, dtype: float64

适用于Series类型

方法说明
.argmin() .argmax()计算数据最大值、最小值所在位置的索引(自动索引)
.idxmin() .idxmax()计算数据最大值、最小值所在位置的索引(自定义索引)

4.3.3 累计统计分析

基本方法

方法说明
.cumsum()累加和
.cumprod()累计乘
.cummax()累计最大值
.cummin()累计最小值
1
2
3
4
5
6
7
8
9
10
11
12
13
14
15
16
17
18
19
20
21
22
23
In [245]: b
Out[245]:
0 1 2 3 4
c 0 1 2 3 4
a 5 6 7 8 9
b 10 11 12 13 14
d 15 16 17 18 19

In [246]: b.cumsum()
Out[246]:
0 1 2 3 4
c 0 1 2 3 4
a 5 7 9 11 13
b 15 18 21 24 27
d 30 34 38 42 46

In [247]: b.cumprod()
Out[247]:
0 1 2 3 4
c 0 1 2 3 4
a 0 6 14 24 36
b 0 66 168 312 504
d 0 1056 2856 5616 9576

滚动计算

方法说明
.rolling(w).sum()依次计算相邻w个元素的和
.rolling(w).mean()依次计算相邻w个元素的平均值
.rolling(w).var()依次计算相邻w个元素的方差
.rolling(w).std()依次计算相邻w个元素的标准差
.rolling(w).min() .max()依次计算相邻w个元素的最大值和最小值
1
2
3
4
5
6
7
8
9
10
11
12
13
14
15
16
17
18
19
20
21
22
23
In [248]: b
Out[248]:
0 1 2 3 4
c 0 1 2 3 4
a 5 6 7 8 9
b 10 11 12 13 14
d 15 16 17 18 19

In [249]: b.rolling(2).sum()
Out[249]:
0 1 2 3 4
c NaN NaN NaN NaN NaN
a 5.0 7.0 9.0 11.0 13.0
b 15.0 17.0 19.0 21.0 23.0
d 25.0 27.0 29.0 31.0 33.0

In [251]: b.rolling(3).max()
Out[251]:
0 1 2 3 4
c NaN NaN NaN NaN NaN
a NaN NaN NaN NaN NaN
b 10.0 11.0 12.0 13.0 14.0
d 15.0 16.0 17.0 18.0 19.0

4.3.4 数据相关分析

相关性

  • 正相关
  • 负相关
  • 不相关

协方差判断相关性

  • $cov(X,Y)>0$ ,X和Y正相关
  • $cov(X,Y)<0$ ,X和Y负相关
  • $cov(X,Y)=0$ ,X和Y独立无关

皮尔森系数判断相关性

  • $r\in(0.8,1.0)$ 极强相关
  • $r\in(0.6,0.8)$ 强相关
  • $r\in (0.4,0.6)$ 中等相关
  • $r\in (0.2,0.4)$ 弱相关
  • $r\in(0,0.2)$ 极弱相关或无关
方法说明
obj1.cov(obj2)计算协方差
obj1.corr(obj2)计算相关系数矩阵,Pearson、Spearman、Kendall等系数
1
2
3
4
5
6
In [253]: hprice = pd.Series([3.04,22.93,12.75,22.6,12.33],index=['2008','2009','2010','2011','2012'])

In [254]: m2 = pd.Series([8.18,18.38,9.13,7.82,6.69],index=['2008','2009','2010','2011','2012'])

In [255]: hprice.corr(m2)
Out[255]: 0.5239439145220387
-------------本文结束-------------